While the rest of the world went on with ASCII and UTF-8; we still find fields in our DB2 database encoded in EBCDIC 037 just to make our lives miserable.
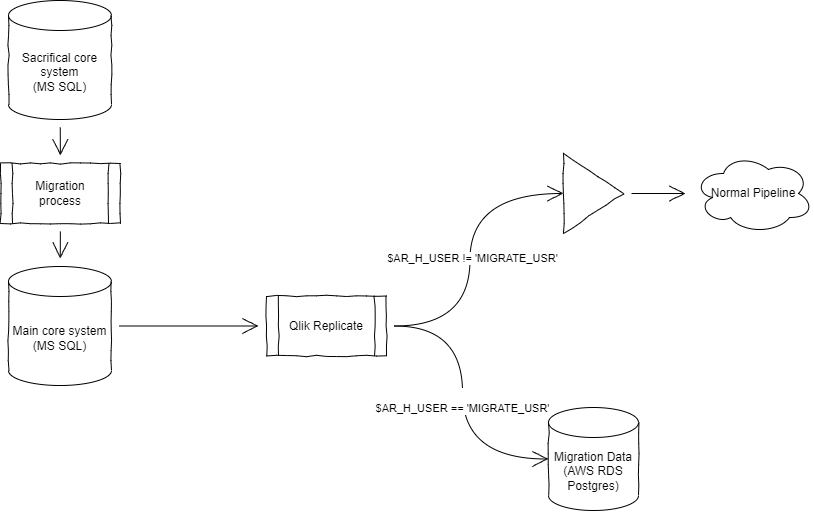
Qlik Replicate when replicating from these fields on its default settings; brings it across as a normal “string” and becomes quite unusable when loaded into a destination system.
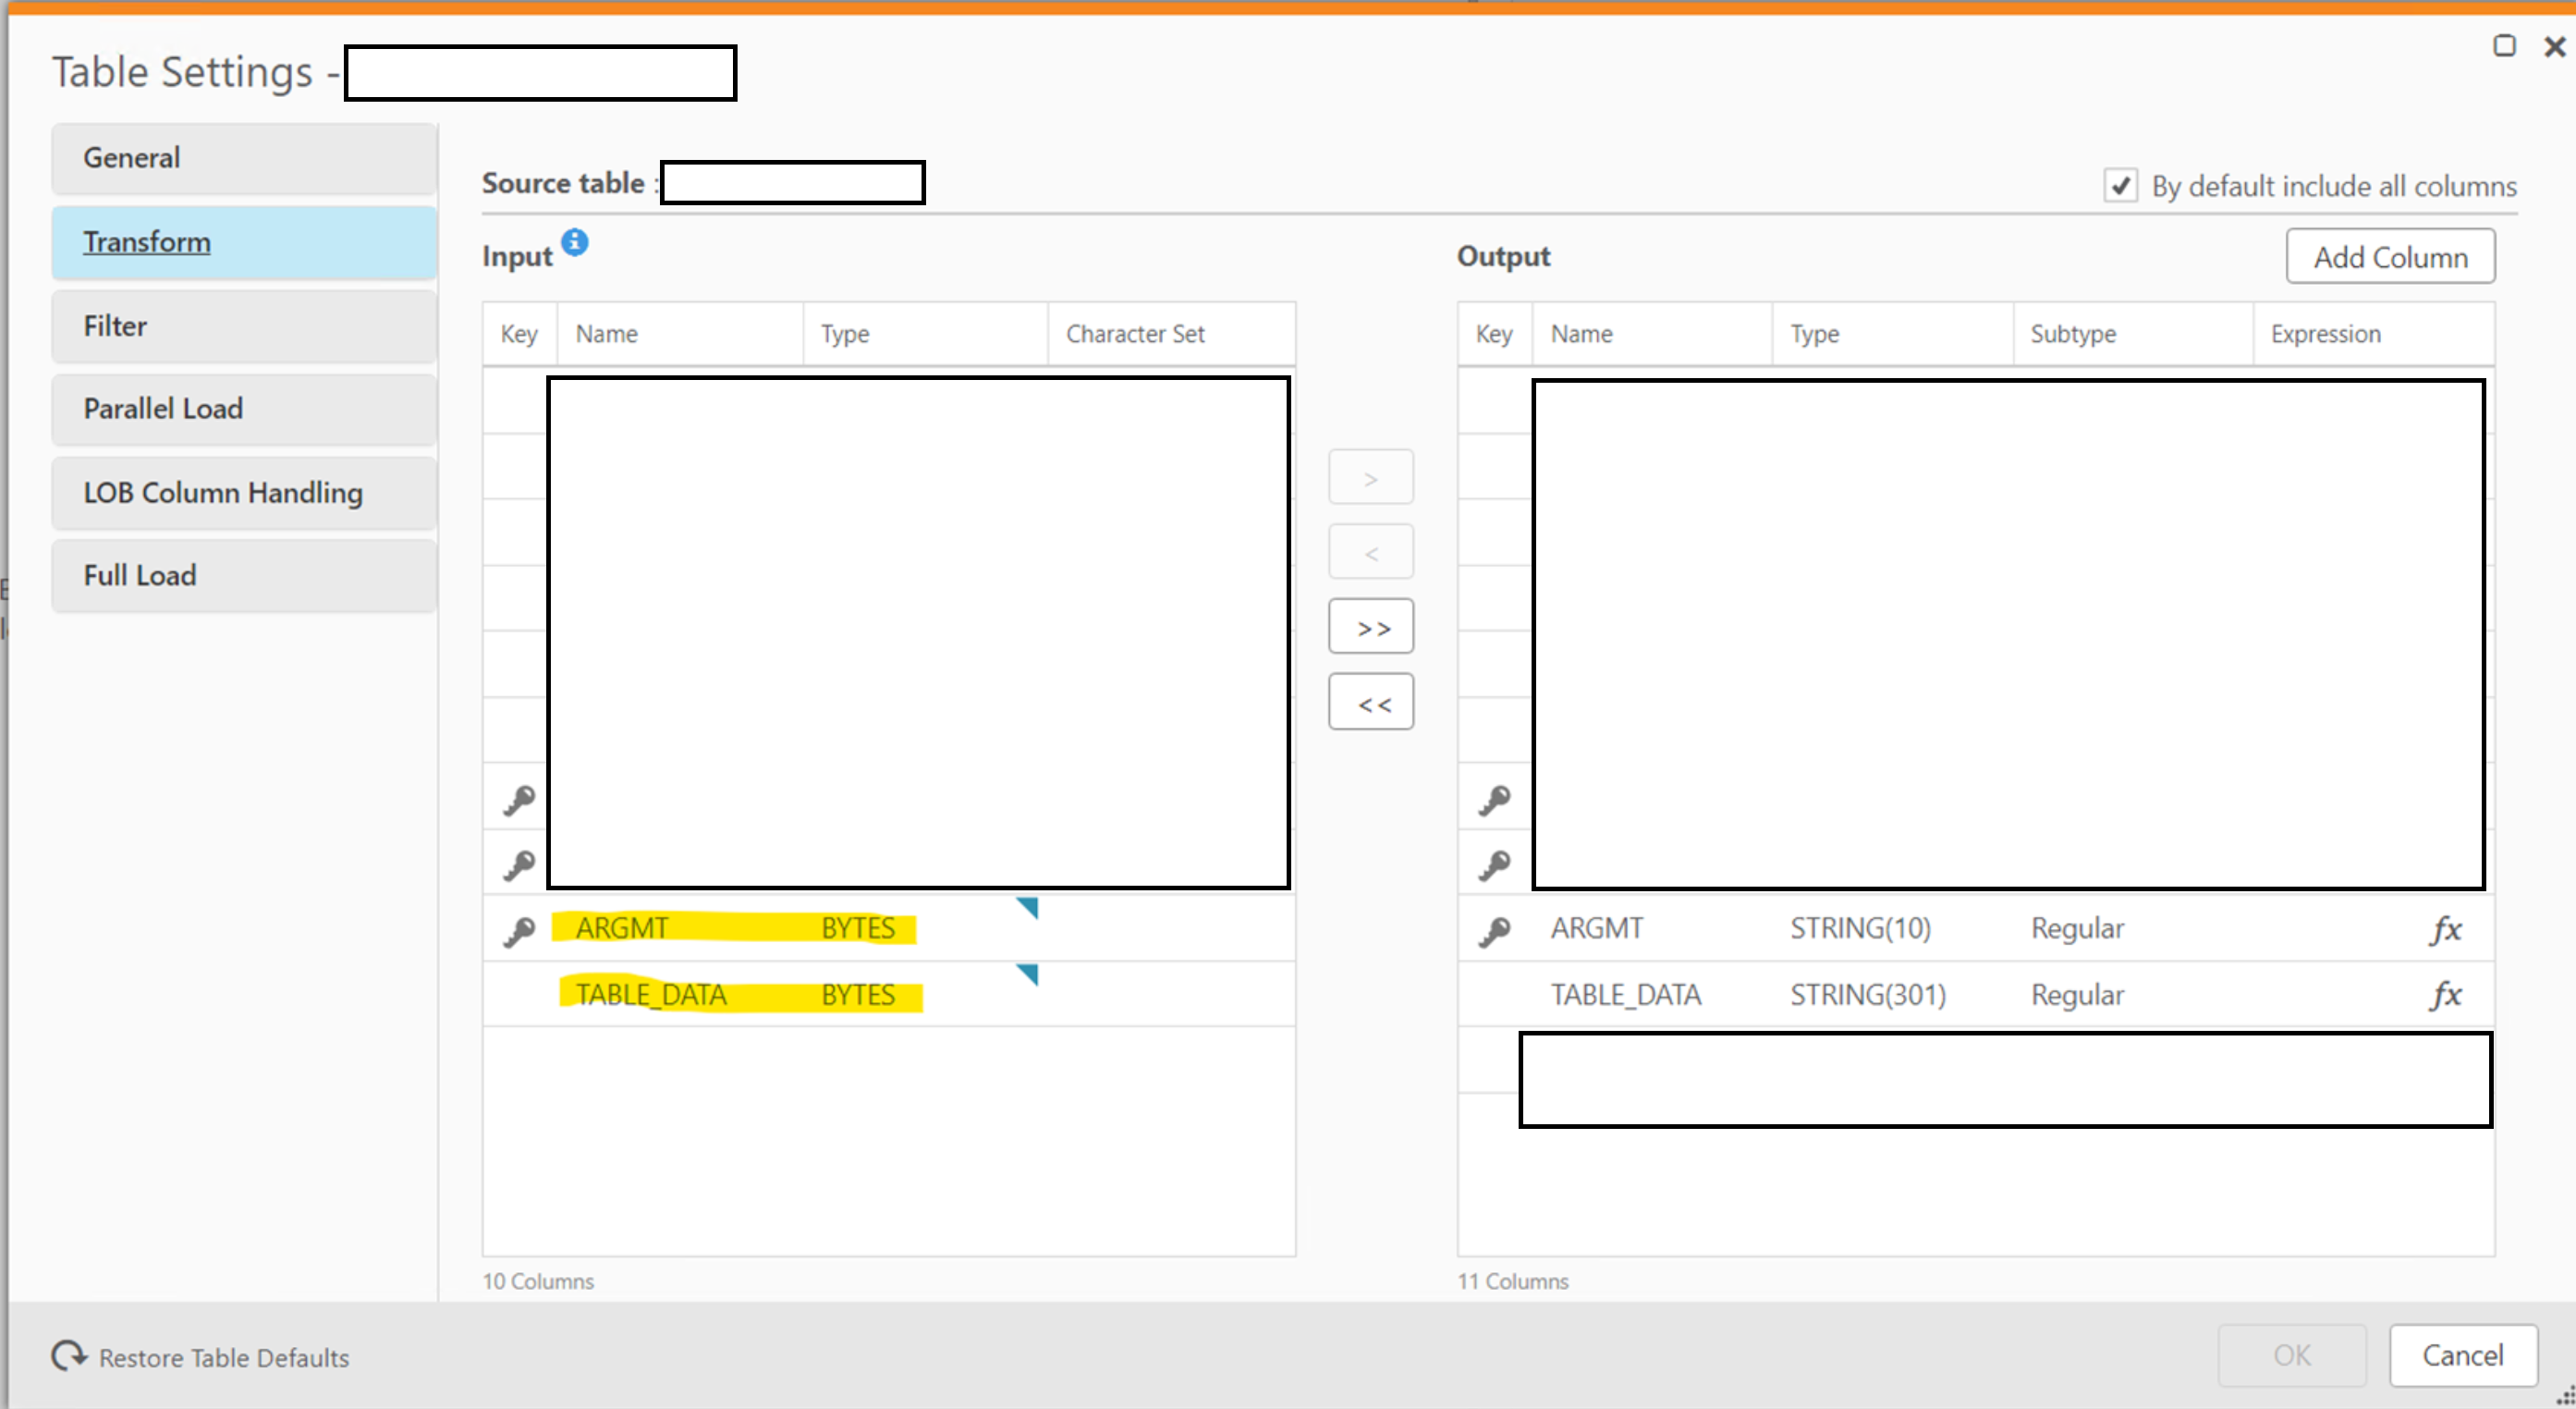
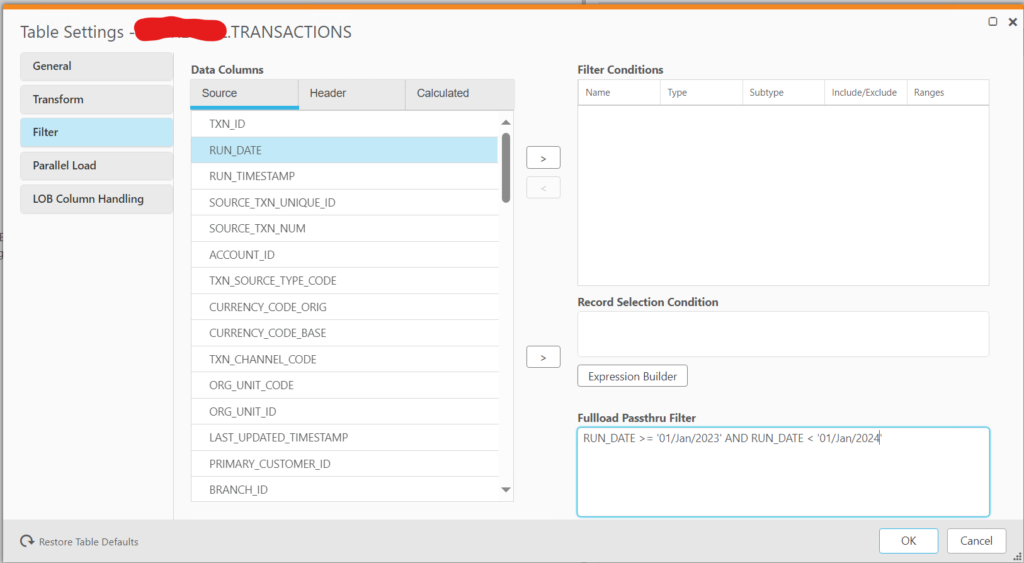
To have the flexibility to decode particular fields in EBCDIC; we need to bring the fields across as BYTES instead of that QR suggests. This can be done in the Table Settings for the table in question:
On the destination Postgres database; load the table into a bytea field.
Now with a udf function in Postgres; we can decode the EBCDIC bytes fields into something readable:
CREATE OR REPLACE FUNCTION public.fn_convert_bytes2_037(
in_bytes bytea)
RETURNS character varying
LANGUAGE 'plv8'
COST 100
VOLATILE PARALLEL UNSAFE
AS $BODY$
const hex_037 = new Map([
["40", " ",],
["41", " ",],
["42", "â",],
["43", "ä",],
["44", "à",],
["45", "á",],
["46", "ã",],
["47", "å",],
["48", "ç",],
["49", "ñ",],
["4a", "¢",],
["4b", ".",],
["4c", "<",],
["4d", "(",],
["4e", "+",],
["4f", "|",],
["50", "&",],
["51", "é",],
["52", "ê",],
["53", "ë",],
["54", "è",],
["55", "í",],
["56", "î",],
["57", "ï",],
["58", "ì",],
["59", "ß",],
["5a", "!",],
["5b", "$",],
["5c", "*",],
["5d", ")",],
["5e", ";",],
["5f", "¬",],
["60", "-",],
["61", "/",],
["62", "Â",],
["63", "Ä",],
["64", "À",],
["65", "Á",],
["66", "Ã",],
["67", "Å",],
["68", "Ç",],
["69", "Ñ",],
["6a", "¦",],
["6b", ",",],
["6c", "%",],
["6d", "_",],
["6e", ">",],
["6f", "?",],
["70", "ø",],
["71", "É",],
["72", "Ê",],
["73", "Ë",],
["74", "È",],
["75", "Í",],
["76", "Î",],
["77", "Ï",],
["78", "Ì",],
["79", "`",],
["7a", ":",],
["7b", "#",],
["7c", "@",],
["7d", "'",],
["7e", "=",],
["7f", ","],
["80", "Ø",],
["81", "a",],
["82", "b",],
["83", "c",],
["84", "d",],
["85", "e",],
["86", "f",],
["87", "g",],
["88", "h",],
["89", "i",],
["8a", "«",],
["8b", "»",],
["8c", "ð",],
["8d", "ý",],
["8e", "þ",],
["8f", "±",],
["90", "°",],
["91", "j",],
["92", "k",],
["93", "l",],
["94", "m",],
["95", "n",],
["96", "o",],
["97", "p",],
["98", "q",],
["99", "r",],
["9a", "ª",],
["9b", "º",],
["9c", "æ",],
["9d", "¸",],
["9e", "Æ",],
["9f", "¤",],
["a0", "µ",],
["a1", "~",],
["a2", "s",],
["a3", "t",],
["a4", "u",],
["a5", "v",],
["a6", "w",],
["a7", "x",],
["a8", "y",],
["a9", "z",],
["aa", "¡",],
["ab", "¿",],
["ac", "Ð",],
["ad", "Ý",],
["ae", "Þ",],
["af", "®",],
["b0", "^",],
["b1", "£",],
["b2", "¥",],
["b3", "·",],
["b4", "©",],
["b5", "§",],
["b6", "¶",],
["b7", "¼",],
["b8", "½",],
["b9", "¾",],
["ba", "[",],
["bb", "]",],
["bc", "¯",],
["bd", "¨",],
["be", "´",],
["bf", "×",],
["c0", "{",],
["c1", "A",],
["c2", "B",],
["c3", "C",],
["c4", "D",],
["c5", "E",],
["c6", "F",],
["c7", "G",],
["c8", "H",],
["c9", "I",],
["ca", "",],
["cb", "ô",],
["cc", "ö",],
["cd", "ò",],
["ce", "ó",],
["cf", "õ",],
["d0", "}",],
["d1", "J",],
["d2", "K",],
["d3", "L",],
["d4", "M",],
["d5", "N",],
["d6", "O",],
["d7", "P",],
["d8", "Q",],
["d9", "R",],
["da", "¹",],
["db", "û",],
["dc", "ü",],
["dd", "ù",],
["de", "ú",],
["df", "ÿ",],
["e0", "\\",],
["e1", "÷",],
["e2", "S",],
["e3", "T",],
["e4", "U",],
["e5", "V",],
["e6", "W",],
["e7", "X",],
["e8", "Y",],
["e9", "Z",],
["ea", "²",],
["eb", "Ô",],
["ec", "Ö",],
["ed", "Ò",],
["ee", "Ó",],
["ef", "Õ",],
["f0", "0",],
["f1", "1",],
["f2", "2",],
["f3", "3",],
["f4", "4",],
["f5", "5",],
["f6", "6",],
["f7", "7",],
["f8", "8",],
["f9", "9",],
["fa", "³",],
["fb", "Û",],
["fc", "Ü",],
["fd", "Ù",],
["fe", "Ú"]
]);
let in_varchar = "";
let build_string = "";
for (var loop_bytes = 0; loop_bytes < in_bytes.length; loop_bytes++)
{
/* Converts a byte character to a hex representation*/
let focus_char = ('0' + (in_bytes[loop_bytes] & 0xFF).toString(16)).slice(-2);
let return_value = hex_037.get(focus_char.toLowerCase());
/* If no mapping found - replace the character with a space */
if(return_value === undefined)
{
return_value = " ";
}
build_string = build_string.concat(return_value)
}
return build_string
$BODY$;