
Introduction
I think as Qlik Replicate developers; we have all been here before.
The testers berating you through MS Teams saying, “We have made a change, and we cannot see it downstream! It is all Qlik Replicate’s fault!”
Opening the task and checking the monitoring screen – I can see the change against the table. What are they going on about? Qlik has picked up something; why can’t they see it? (Sixty percent of the time; something downstream has failed, twenty percent of the time something upstream has failed, nineteen percent of the time they are looking in the wrong spot and the remaining one percent of the time – well we won’t mention that one percent.)
But looking at the monitoring screen – what does those numbers mean? Also, if you look in the analytics database; what does those figures mean?
Hopefully, this article will help you understand the monitoring and analytics numbers with some simple examples.
Filters – why does it have to be filters?
We have two main types of Qlik Replicate tasks. One type grabs all changes from a particular table and sends it to our Data Lake in micro batches of fifteen minutes.
The other type are our speed tasks; only grabbing changes on specific columns on a table. To limit QR to only picking up specific changes; we have filters like this:
($AR_H_OPERATION != 'UPDATE' AND $AR_H_OPERATION != 'DELETE') OR
(
  ($AR_H_OPERATION == 'UPDATE') AND
  (
    ( $BI__FIELD_1 != $FIELD_1 ) OR ( $BI__FIELD_1 IS NULL AND $FIELD_1 IS NOT NULL ) OR ( $BI__FIELD_1 IS NOT NULL AND $FIELD_1 IS NULL ) OR
    ( $BI__FIELD_2 != $FIELD_2 ) OR ( $BI__FIELD_2 IS NULL AND $FIELD_2 IS NOT NULL ) OR ( $BI__FIELD_2 IS NOT NULL AND $FIELD_2 IS NULL ) OR
    ( $BI__FIELD_3 != $FIELD_3 ) OR ( $BI__FIELD_3 IS NULL AND $FIELD_3 IS NOT NULL ) OR ( $BI__FIELD_3 IS NOT NULL AND $FIELD_3 IS NULL )
 )
)
So, the question is – if we made an update to $FIELD_4 meaning that QR will send the change downstream; what would the monitoring tab on the task display?
Let is create an example to find out.
An example
Here is a simple table -pre-populated with six record:
CREATE TABLE dbo.CDC_ANALYTICS_EXAMPLE
(
	RECORD_ID INT IDENTITY(1,1) PRIMARY KEY,
	DATA_INT INT,
	DATA_VARCHAR VARCHAR(100),
	INCLUDE_RECORD CHAR(1)
);

GO

INSERT INTO dbo.CDC_ANALYTICS_EXAMPLE VALUES(1, 'Record 1', 'Y');
INSERT INTO dbo.CDC_ANALYTICS_EXAMPLE VALUES(2, 'Record 2', 'Y');
INSERT INTO dbo.CDC_ANALYTICS_EXAMPLE VALUES(3, 'Record 3', 'Y');
INSERT INTO dbo.CDC_ANALYTICS_EXAMPLE VALUES(4, 'Record 4', 'N');
INSERT INTO dbo.CDC_ANALYTICS_EXAMPLE VALUES(5, 'Record 5', 'N');
INSERT INTO dbo.CDC_ANALYTICS_EXAMPLE VALUES(6, 'Record 6', 'N');

SELECT *
FROM dbo.CDC_ANALYTICS_EXAMPLE WITH (NOLOCK);
And we create a simple QR task with the following filters:
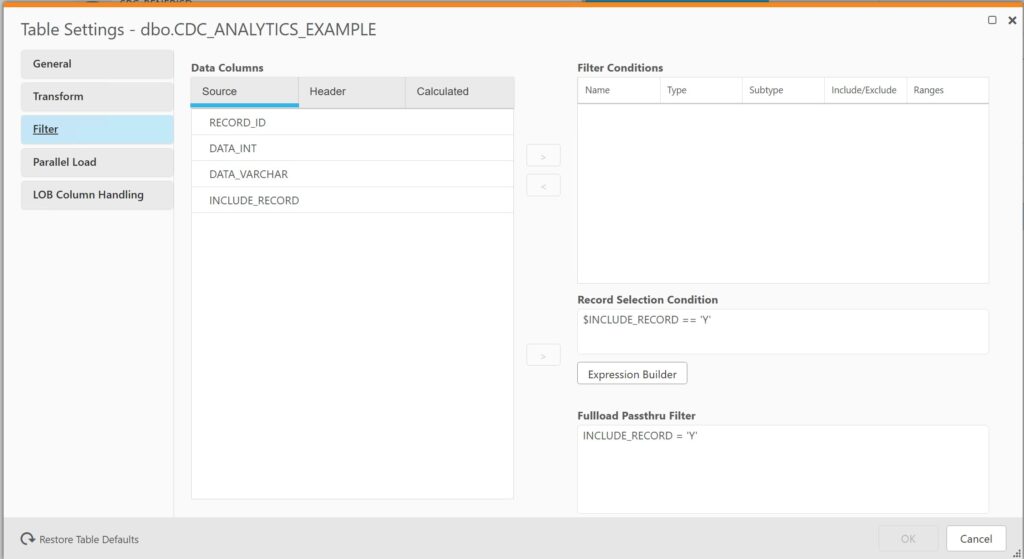
The first filter is the Fullload Passthru Filter. When the full load initially runs; only three of the six records will be brought across.
The second filter Record Selection Condition; should filter any data changes on when $INCLUDE_RECORD has a value of ‘Y’.
Results after running the QR task
Full load
After running the full load; qlik shows the following on the monitoring screen:
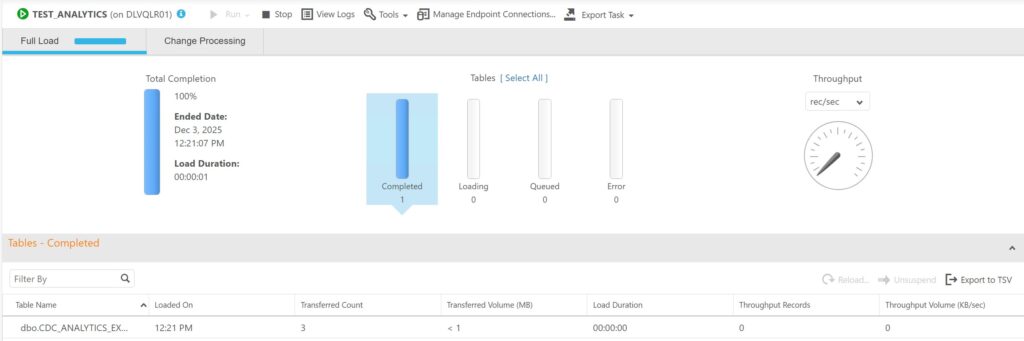
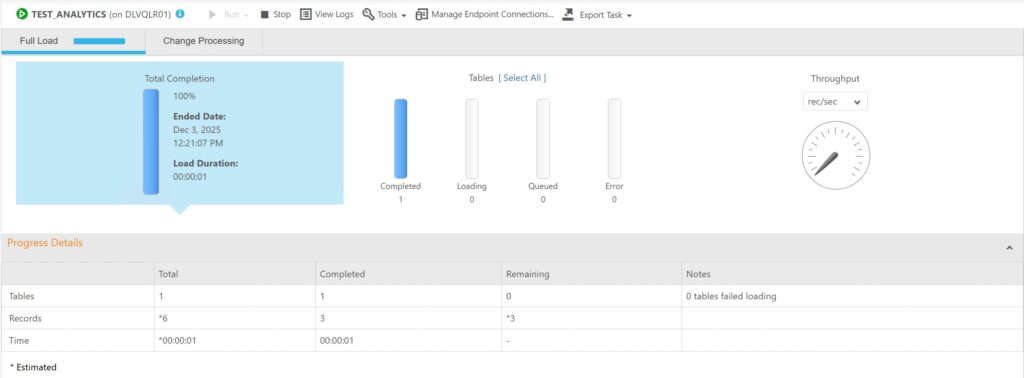
Three records – that’s what we expected out of the six.
Interesting under the “Total Completion” section; the distinction of the filter is quite clear. Three records brought across and three remaining.
Change Processing
Let’s make some changes to the data in our test table:
-- This will be captured
BEGIN TRANSACTION
	DECLARE @IDENTITY INT;

	INSERT INTO dbo.CDC_ANALYTICS_EXAMPLE VALUES(null, 'Record x', 'Y');
	SET @IDENTITY = @@IDENTITY;

	UPDATE dbo.CDC_ANALYTICS_EXAMPLE
	SET DATA_INT = @IDENTITY,
		DATA_VARCHAR = 'Record ' + CAST(@IDENTITY AS varchar)
	WHERE RECORD_ID = @IDENTITY;

	DELETE dbo.CDC_ANALYTICS_EXAMPLE WHERE RECORD_ID = @IDENTITY;

COMMIT;

GO

-- This will be excluded
BEGIN TRANSACTION
	DECLARE @IDENTITY INT;

	INSERT INTO dbo.CDC_ANALYTICS_EXAMPLE VALUES(null, 'Record x', 'N');
	SET @IDENTITY = @@IDENTITY;

	UPDATE dbo.CDC_ANALYTICS_EXAMPLE
	SET DATA_INT = @IDENTITY,
		DATA_VARCHAR = 'Record ' + CAST(@IDENTITY AS varchar)
	WHERE RECORD_ID = @IDENTITY;

	DELETE dbo.CDC_ANALYTICS_EXAMPLE WHERE RECORD_ID = @IDENTITY;

COMMIT;
This is what the monitoring screen shows:
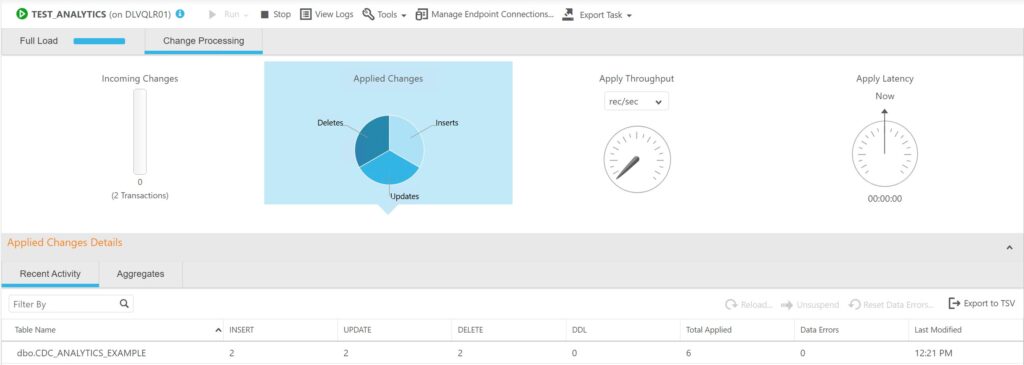
Looking at the Recent activity screen; hmm – this could lead to some confusion.
The metrics shows the two blocks of changes; even though one block was filtered out. So this is indicating that this gives the results when there is a change in the table; not matter if it was subsequently filtered out.
If those testers in the opening paragraph created a record that was filtered out in QR; we could give them false direction if we said “it should be downstream”
If we look at the Aggregates screen; it paints a true picture of what was detected and transferred to the target:
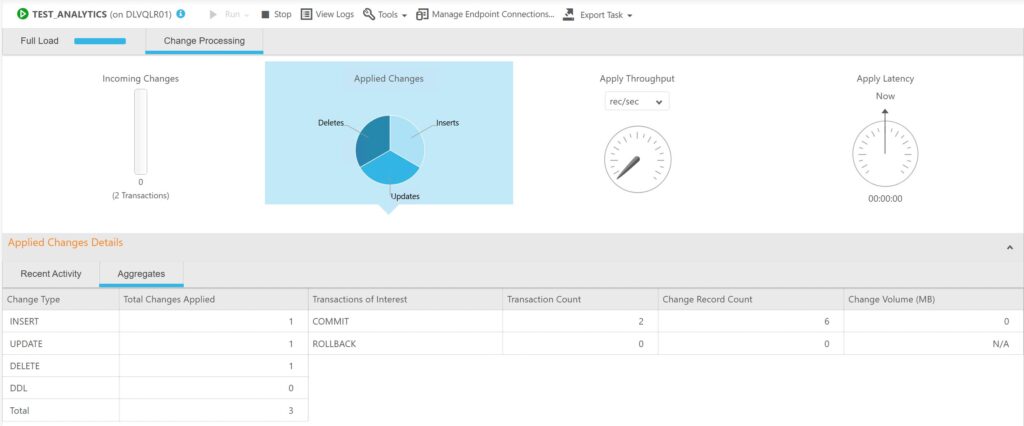
We can see the three records in the “Total Changes Applied” column.
Analytics database
From the analytic database:
SELECT
    *
FROM public.aem_taskv t
WHERE
    t.task_name IN ('TEST_ANALYTICS')
ORDER BY
     t.server_name, t.task_name, t.retrieval_time
| Field | Value |
|---|---|
| id | 110876201 |
| retrieval_time | 2025-12-03 12:02 |
| server_id | 5 |
| task_name_id | 914 |
| task_state_id | 3 |
| task_stop_reason_id | 1 |
| task_profile_id | 1 |
| cdc_evt_applied_insert_count | 1 |
| cdc_evt_applied_update_count | 1 |
| cdc_evt_applied_delete_count | 1 |
| cdc_evt_applied_ddl_count | 0 |
| full_load_tables_completed_count | 1 |
| full_load_tables_loading_count | 0 |
| full_load_tables_queued_count | 0 |
| full_load_tables_with_error_count | 0 |
| full_load_total_records_transferred | 3 |
| full_load_est_records_count_for_all_tables | 6 |
| full_load_completed | 1 |
| full_load_start | 2025-12-03 10:57 |
| full_load_finish | 2025-12-03 10:57 |
| full_load_thrput_src_thrput_records_count | 0 |
| full_load_thrput_src_thrput_volume | 0 |
| full_load_thrput_trg_thrput_records_count | 0 |
| full_load_thrput_trg_thrput_volume | 0 |
| cdc_thrput_src_thrput_records_count | 0 |
| cdc_thrput_src_thrput_volume | 0 |
| cdc_thrput_trg_thrput_records_count | 0 |
| cdc_thrput_trg_thrput_volume | 0 |
| cdc_trans_read_rollback_count | 0 |
| cdc_trans_read_records_rollback_count | 0 |
| cdc_trans_rollback_change_volume | 0 |
| cdc_trans_applied_transactions_in_progress_count | 0 |
| cdc_trans_applied_records_in_progress_count | 0 |
| cdc_trans_applied_comitted_transaction_count | 2 |
| cdc_trans_applied_records_comitted_count | 6 |
| cdc_trans_applied_volume_committed | 0 |
| cdc_trans_read_memory_events_count | 0 |
| cdc_trans_read_swapped_events_count | 0 |
| cdc_trans_applied_memory_events_count | 0 |
| cdc_trans_applied_swap_events_count | 0 |
| cdc_source_latency | 0 |
| cdc_apply_latency | 0 |
| memory_usage_kb | 0 |
| disk_usage_kb | 0 |
| cpu_percentage | 0 |
| data_error_count | 0 |
| task_option_full_load_enabled | 1 |
| task_option_apply_changes_enabled | 0 |
| task_option_store_changes_enabled | 1 |
| task_option_audit_changes_enabled | 0 |
| task_option_recovery_enabled | 0 |
| cdc_trans_read_in_progress | 2 |
| server_cpu_percentage | 0 |
| machine_cpu_percentage | 16 |
| tasks_cpu_percentage | 0 |
| server_name | xxxx |
| task_name | TEST_ANALYTICS |
| server_with_task_name | xxxx::::TEST_ANALYTICS |
A couple of take aways from the results:
- Unfortunately the records in the the analytic database is grouped up at a task level; not at an individual table level. This makes it harder to determine if a change from a particular table was applied
- cdc_trans_applied_records_comitted_count is a count of all the records read; but not necessarily applied
- If you want the number of records flowing down to downstream; add together the fields cdc_evt_applied_insert_count, cdc_evt_applied_update_count and cdc_evt_applied_delete_count together
Final thoughts
The monitoring and analytics screen is useful tools for diagnosing QR tasks – and general ASMR; watching the numbers bounce up as transactions flow through the system.
Understanding the figures of what they translate to – whether changes getting detected or applied downstream is fundamental in diagnosing problems.
Nothing is better than getting access to the source and target systems and checking yourself to confirm if things are working correctly; but the monitoring screen is a good place to start investigating.