It’s all fun and games – until Qlik Replicate must copy 6 billion rows from a very wide Oracle table to GCS…
…in a small time window
…with the project not wanting to perform Stress and Volume testing
Oh boy.
Our Dev environment had 108 milling rows to play with, which ran “quick” in relationship the amount of data it had to copy. But being 33 times smaller; even if it takes an hour in Dev – extrapolating the time out will relate to over 30 hours of run time.
The project forged ahead in the implementation and QR only processed 2% of the changes before we ran out of the time window.
The QR servers didn’t seem stressed performance wise; had plenty of CPU and RAM. I suspect the bottle neck was in the bandwidth going out to GCS; but there was no way to monitor how much of the connection has been used.
When in doubt – change the file type
After the failed implementation, we tried to work out how we can improve the throughput to GCS in our dev environment.
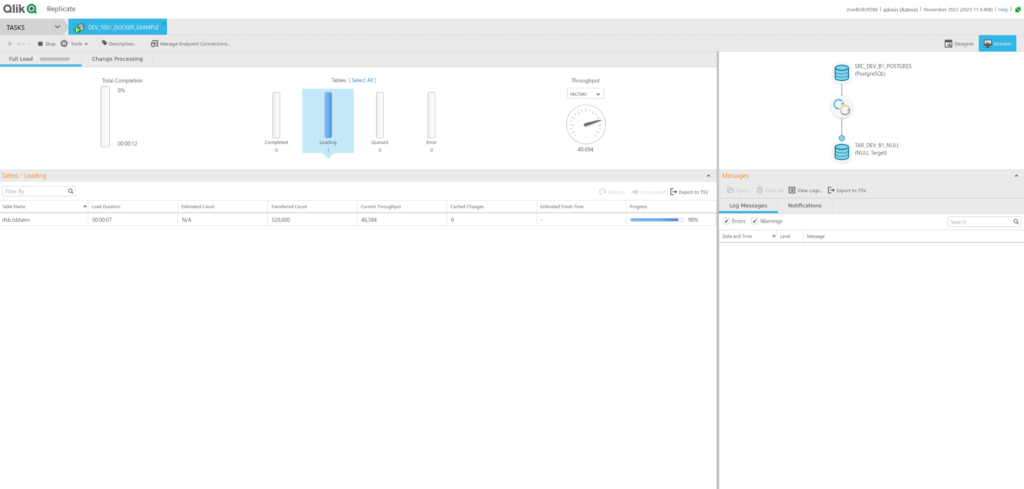
I thought changing the destination’s file type might be a way. JSON is a chunky file format, and my hypothesis was if the JSON was compressed it would transfer to GCS quicker. We tested out a NULL connector, raw JSON, GZIP JSON and Parquet. As a test using Dev – we let a test task run for 20min to see how much data is copied across.
Full Load Tuning:
- Transaction consistency timeout (seconds): 600
- Commit rate during full load: 100000
Endpoint settings:
- Maximum file size(KB): 1000000 KB (1GB)
Results
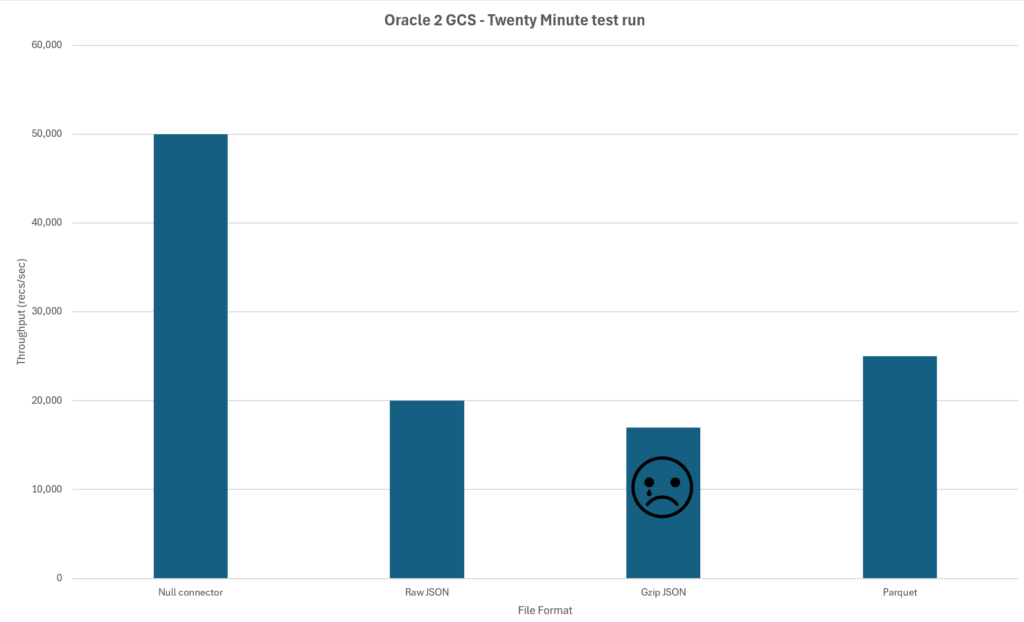
Unfortunately, my hypothesis on compressed JSON was incorrect. We speculated that compressing the JSON might have been taking up as much time as transferring it. I would have like to test this theory on a quieter QR server, but time is of the essence.
Parquet seemed to be the winner with the limited testing offering a nice little throughput boost over the JSON formats. But it wasn’t the silver bullet to our throughput problems. Added onto this; the downstream users would need to spend time modifying their ingestion pipelines.
Divide and conquer – until Oracle says no.
The next stage was to look if we could divide the table up into batches and transfer across section at a time. Looking at the primary key; it was an identity column that had little meaningful relation to easily divide up into batches.
There was another indexed column called RUN_DATE; which is a date relation to when the record was entered.
OK – let’s turn on Passthrough filtering and test it out.
First of all to test the syntax out in SQL Developer
SELECT COUNT(*)
FROM xxxxx.TRANSACTIONS
WHERE
    RUN_DATE >= '01/Jan/2023' AND
    RUN_DATE < '01/Jan/2024';
The query ran fine meaning that the date syntax was right.
Looking good – let’s add the filter to the Full Load Passthru Filter
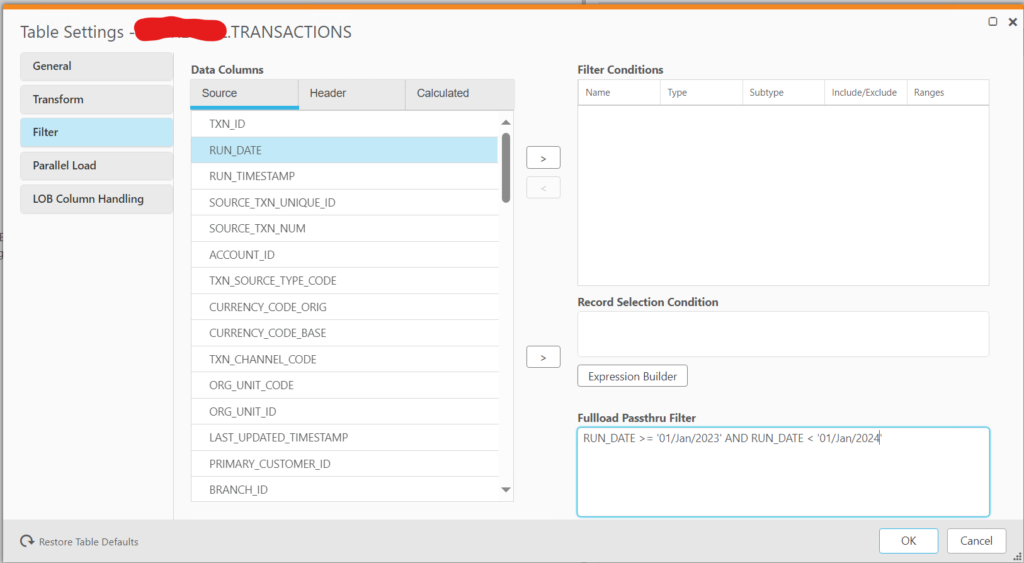
But when running the task; it goes into “recoverable error” mode.
Looking into the logs:
00014204: 2024-11-26T08:38:26:184700 [SOURCE_UNLOAD   ]T:  Select statement for UNLOAD is 'SELECT "PK_ID","RUN_DATE", "LOTS", "OF", "OTHER, "COLUMNS"  FROM "xxxxx"."TRANSACTIONS" WHERE (RUN_DATE >= '01/Jan/2023' AND RUN_DATE < '01/Jan/2024')'  (oracle_endpoint_utils.c:1941)
00014204: 2024-11-26T08:38:26:215961 [SOURCE_UNLOAD   ]T:  ORA-01858: a non-numeric character was found where a numeric was expected  [1020417]  (oracle_endpoint_unload.c:175)
00014204: 2024-11-26T08:38:26:215961 [SOURCE_UNLOAD   ]T:  Failed to init unloading table 'xxxxx'.'TRANSACTIONS' [1020417]  (oracle_endpoint_unload.c:385)
00014204: 2024-11-26T08:38:26:215961 [SOURCE_UNLOAD   ]E:  ORA-01858: a non-numeric character was found where a numeric was expected  [1020417]  (oracle_endpoint_unload.c:175)
00014204: 2024-11-26T08:38:26:215961 [SOURCE_UNLOAD   ]E:  Failed to init unloading table 'xxxxx'.'TRANSACTIONS' [1020417]  (oracle_endpoint_unload.c:385)
00014204: 2024-11-26T08:38:26:215961 [SOURCE_UNLOAD   ]T:  Error executing source loop [1020417]  (streamcomponent.c:1942)
00014204: 2024-11-26T08:38:26:215961 [SOURCE_UNLOAD   ]T:  Stream component 'st_1_SRC_DEV_B1_xxxxx' terminated [1020417]  (subtask.c:1643)
00014204: 2024-11-26T08:38:26:215961 [SOURCE_UNLOAD   ]T:  Free component st_1_SRC_DEV_B1_xxxxx  (oracle_endpoint.c:51)
00011868: 2024-11-26T08:38:26:215961 [TASK_MANAGER    ]I:  Task error notification received from subtask 1, thread 0, status 1020417  (replicationtask.c:3603)
00014204: 2024-11-26T08:38:26:215961 [SOURCE_UNLOAD   ]E:  Error executing source loop [1020417]  (streamcomponent.c:1942)
00014204: 2024-11-26T08:38:26:215961 [TASK_MANAGER    ]E:  Stream component failed at subtask 1, component st_1_SRC_DEV_B1_xxxxx  [1020417]  (subtask.c:1474)
00014204: 2024-11-26T08:38:26:215961 [SOURCE_UNLOAD   ]E:  Stream component 'st_1_SRC_DEV_B1_xxxxx' terminated [1020417]  (subtask.c:1643)
00011868: 2024-11-26T08:38:26:231570 [TASK_MANAGER    ]W:  Task 'TEST_xxxxx' encountered a recoverable error  (repository.c:6200)
Error code ORA-01858 seems to be the key to the problem. As an experiment I copied out the select code and ran it into SQL Developer.
Works fine 🙁
OK – maybe it is a quirk of SQL Developer?
Using sqlplus I ran the same code from the command line.
Again works fine 🙁
Resorting to good old Google – I searched ORA-01858.
The top hit was this article from Stack Overflow that recommended confirming the format of the date with the TO_DATE function.
OK Oracle; if you want to be fussy with your dates – let’s explicitly define the date format with TO_DATE in the Full Load Passthru Filter.
RUN_DATE >= TO_DATE('01/Jan/2023','DD/Mon/YYYY') AND RUN_DATE < TO_DATE('01/Jan/2024','DD/Mon/YYYY')
Ahhhh – that works better and Qlik Replicate now runs successfully with the passthrough filter.
Conclusion
I tried a different set of date formats; including an ISO date format and Oracle spat them all out. So using TO_DATE is the simplest way to avoid the ORA-01858 error. I can understand Oracle refusing to run on a date like 03/02/2024; I mean is it the 3rd of Feb 2024; or for Americans the 2nd of Mar 2024? But surprised something very clear like an ISO date format; or 03/Feb/2024 did not work.
Maybe how SQL Developer and SQLplus interacts with the database is different than QR that leads to the different in behaviour of how filters on dates work.