Qlik Replicate is growing rapidly in our organisation.
Starting with one “Proof of concept” server in DTL; we are now up to seventeen. A mixture of development, test, performance testing servers on OnPrem and in the AWS and GCS cloud; depending where the source database is located.
With trying to keep things neat and organised; we are constantly moving QR tasks from one server to another.
Anyway the Juniors came to me with the following error message when they were shifting a QR task with a AWS RDS postgres source:
2024-01-31T16:39:38[SOURCE_CAPTURE ]E: Can't resume task after replication slot was dropped. [1020101] (postgres_endpoint_capture.c:444)
From my understanding (I wasn’t babysitting their process); they exported the old task out with Endpoints and then reimported it into the new server. They re-entered the passwords for the end points and then try to resume from the stream position of the old task.
I couldn’t fault that logic.
As a test we cloned that task on the same server and made the target endpoint as a NULL.
With this test task we could
Start the task from scratch
Resume it from the stream position that the old task got up to
This proved that the new server had no issues contacting the database and resuming from a position on the postgres database.
In the end I guessed that there was a problem with the replication slot (or lack of) for that task on the postgres server; not sure specifically but it was looking for something that it didn’t exist.
I worked out the following steps to resolve the problem:
Change the task’s target endpoint to a NULL connector.
Start the task with the “Reload Target” option.
Wait until the task has done the “Full load” and has entered CDC mode.
Stop the task and change the target endpoint back to the original end point.
Start the task again with “Advance Run Options” and resume from the “Source change position” of the original taks.
It seems every new project; the project teams come with new and innovative ways to make my life “interesting” while managing Qlik Replicate.
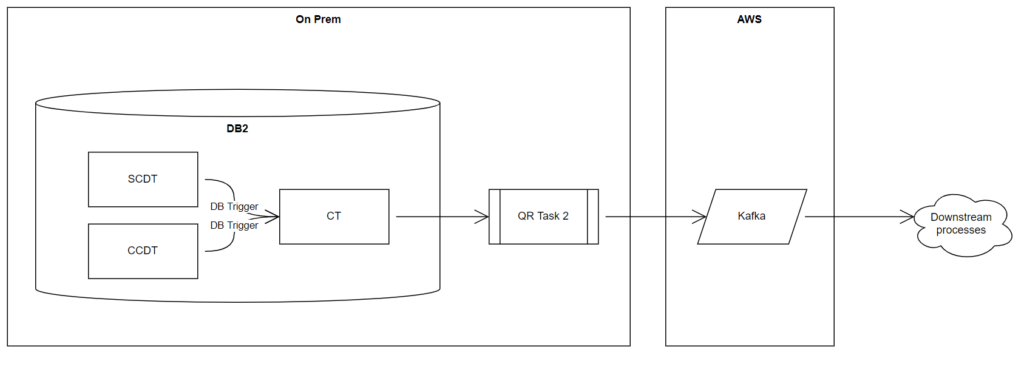
The latest idea they have is to pretty much request that one of our major Qlik Replicate tasks that is sucking data our of a DB2 database and delivering data to AWS S3 be duplicated and deliver pretty much the same data to GCS.
When I got wind of this proposal it was already too far into the solution design to propose another solution; like copying the data from GCS to AWS S3. So, it was left up to me to go and tell the owners of the DB2 system that there is another massive feed will be built of their database – basically doing the same thing.
With some persuasion I could get internal funding to research and implement Log Streaming to consolidate our reads from the DB2 system. Hardware wise this required adding more memory and disk space to the QR servers to handle the log streaming.
As for the Log stream component of the solution, I started looking into the settings. Since we are drawing a lot of data from DB2 – I am concerned about disk space and what performance impact the compression setting has on the task.
To test the impact; I set up the following test scenario:
The "Million row" challenge
To test – I created a very wide table in a test MS-SQL (a database I had access to); which contained integers and varchars.
With a python script, a million rows were inserted into the table in batches of 10,000. In the end the million rows equated to about 1.3Gb on the database.
I did ten test runs, increasing the compression in the log stream endpoint with each individual run.
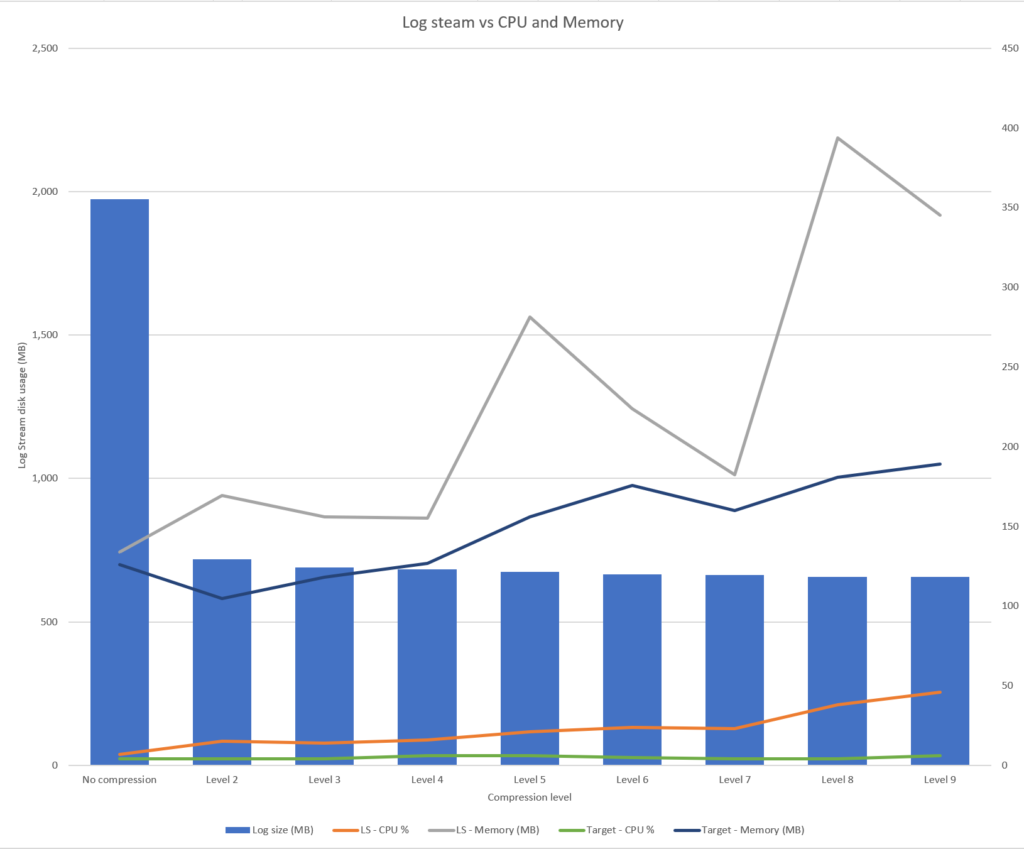
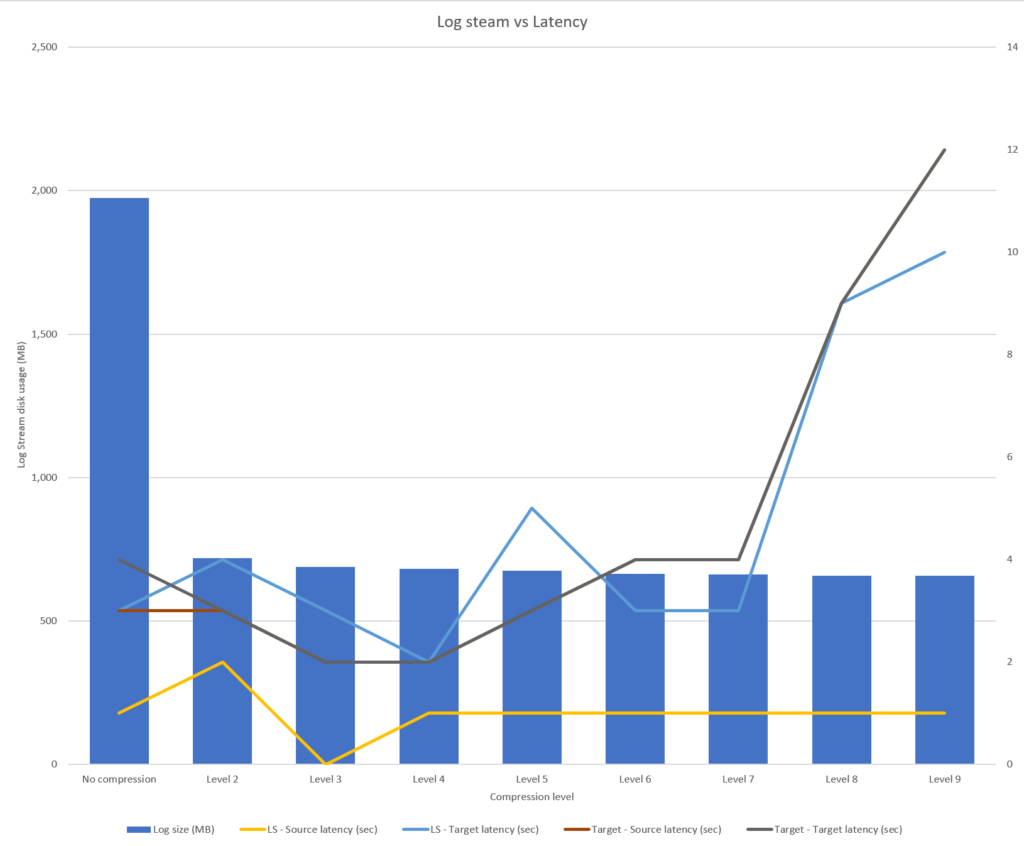
Using Qlik Replicate’s analytics I could then get the metrics for the Log Stream’s task; and a task that is reading from the log stream and outputting the data to a NULL endpoint.
I also grabbed the file sizes that the log stream created on the server’s drive.
Here are the results:
Log Stream File Size (Mb)
LS – CPU %
LS – Memory (MB)
LS – Source latency (sec)
LS – Target latency (sec)
Target – CPU %
Target – Memory (MB)
Target – Source latency (sec)
Target – Target latency (sec)
No compression
1,974
7
134
1
3
4
126
3
4
Level 2
718
15
169
2
4
4
105
3
3
Level 3
690
14
156
0
3
4
118
2
2
Level 4
683
16
155
1
2
6
127
2
2
Level 5
675
21
281
1
5
6
156
3
3
Level 6
665
24
224
1
3
5
176
4
4
Level 7
663
23
182
1
3
4
160
4
4
Level 8
657
38
394
1
9
4
181
9
9
Level 9
657
46
345
1
10
6
189
12
12
Some notes on the results
The run was done on a shared server; so other processes on the server running at the same time could impact the CPU and memory metrics
Analytics only takes a snapshot of the metrics every 5min and the million rows are inserted into the database in less than <10min so we can only get one snapshot of the metrics for the run. Depending where the run was up to; this could impact the metrics
Conclusions
Like most things in IT; there is no magical setting that will cover all scenarios. Everything is a compromise, and the settings will need to be adjusted to meet one’s particular source endpoint, nature of the data being replicated, and the latency can be tolerated to disk space usage.
Here is what I learnt.
If you require absolute minimum latency as possible – log steaming is not your answer for a couple of reasons.
There is an inherited one second delay writing batches from the source system to the log stream.
All the data is written to disk and then read by the target QR task. This means that the changes do not reside in memory and need to be read from disk.
Level 2 significantly reduces disk space usage with little compromise to speed and resource usage.
Level 4 is the best compromise of disk space, speed, and resource usage. Anything above level 4 starts to strain the speed and resource usage with little improvement to disk space.
Implementing Log streaming plan
For my scenario – I think Level 2 is the way to go and will stem my testing out from there.
My implementation plan is to implement the log streaming task into production and let it run by itself for a couple of weeks.
During that time, I will monitor how the log stream task behaves with large batches and how much data it writes to disk as we cannot generate that amount data in our performance testing environments.
Once the log stream task is settled; then I will start migrating the existing Qlik Replicate tasks to read from the log stream task stream instead of directly from the database.
It is one of my favourite services that I have running on my home network.
I definitely take Pi-Hole for granted at home and only really appreciate how effective it is when I travel and connect to other networks.
While the function of Pi-Hole is brilliant – my Data warehouse Analyst and reporting background craves for more power from the metrics behind Pi-Hole.
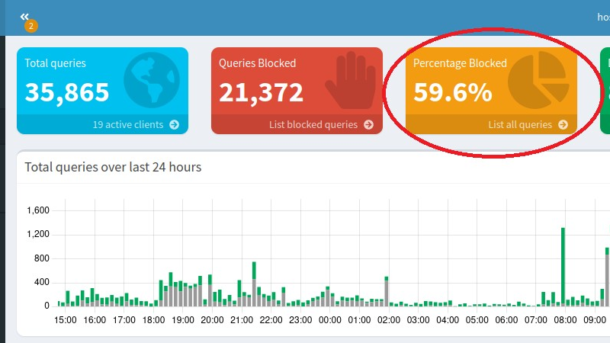
By default Pi-Hole offers a simple dashboard with a few catchy graphs and metrics. This can be hypnotizing to watch when first installing Pi-Hole; watching shock of how many DNS queries are blocked visiting different websites.
Behind the scenes is a sqlite database located on the server for more power users to query.
We need more power!
For me – I have a couple of problems with the Pi-Hole dashboard and crave for more functionality and power from what is on offer.
Some issues I have:
On my home network – I have two Pi-Hole servers working in a redundancy. The main Pi-Hole server is sitting on a hypervisor while the backup one is on a Raspberry Pi. The main rational of this is that if we have a power outage that knocks the hypervisor offline while I am not at home; the backup Pi-Hole server will take over and save an angry phone call from the wife on why she can’t access the internet.
One of my wishes is to see the combined Pi-Hole metrics across both servers in one dashboard.
A couple of items on the network creates a large amount of noise that skews the metrics. For instance the security cameras use to query a NTP server every second until I routed them through a NTP server at home. My work computer when it drops off the VPN will flood particular addresses with traffic.
I would like to exclude these addresses from the metrics; but not exclude them from the P-Hole functionality.
Access to better analytics from the Pi-Hole data.
How about a heat map of blocked queries on devices?
Or weekly trends with a moving average?
Or ability to drill into a time where there is a high amount of blocked traffic to determine the device and application is behind it? (Answer: My kid playing mobile app games)
Napkin Solution
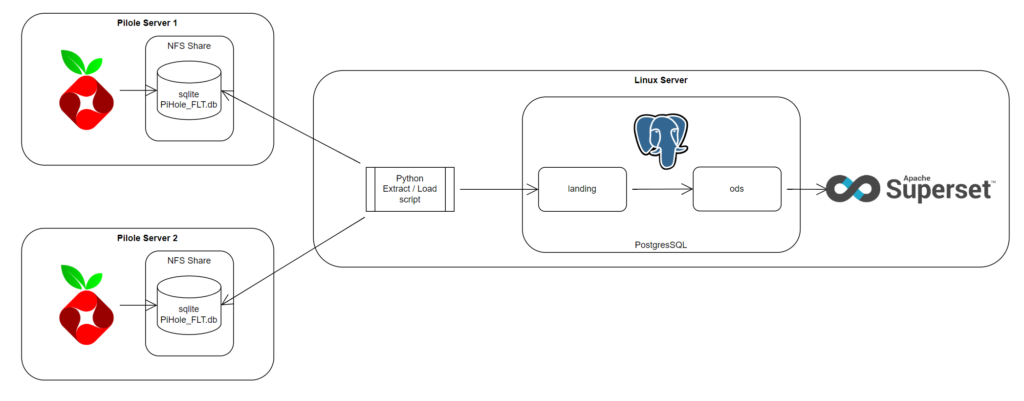
This is what I am working on at the moment to extract and load the data from my two Pi-Hole servers into a Postgres database to query from.
A NFS share is set up to share out the pihole-FLT.db to a linux server on both Pi-Hole servers
A cron job runs every x minutes to run a python script. The python scrip will query the pihole-FTL.db to get the records from the last timestamp it ran to the current timestamp in the Pi-Hole database and land the data in to a “landing” schema on the postgres database
A stored procedure will run to transfer and normalise the data into an ods schema
A reporting tool will then query off the ods schema. In this case I am using Apache Superset; just because it was freely available and the web nature means I can share dashboards to multiple devices without installing client software.
Performance of querying sqlite through a NFS share
Initially I was worried about querying the pihole-FTL.db over the NFS share; thinking it will be too slow to be practical.
I was thinking of a few clunky solutions:
Copy the entire DB over to the postgres host and load it from there
Write a script that runs on the Pi-Hole server to extract the incremental data from the pihole-FLT.db into files and load the files
Thankfully from the volume of traffic we produce; it is not a concern.
The initial load of copying all the data out of the Pi-Hole database does take a long time if there is a large amount of history to transfer across.
But once the initial load is done; small incremental bites of data only take a few seconds
Current state
I have a pilot running on my home network as a proof of concept.
Fundamentally it works fine and I can gleam some interesting metrics from my Pi-Hole servers.
At the moment the security is not great atrocious as I am just using a super username and password throughout the pipeline.
Once I have cleaned up the postgres sql, python code I can share the complete solution.
A new team will be taking over for out of hours oncall for Qlik Replicate and I tasked with training up a new team to diagnose and resolve problems with QR.
I thought it was a good idea to create some practice QR tasks in our development environment; intentionally put some problems in the tasks and let the new team diagnose the problem in a safe and no pressure scenarios.
I did the obvious ones; like put an incorrect password in an end point, put a typo in a filter criteria.
Looking for another scenario I thought – “Nothing better than a divide by zero error.”
Wait. That’s Illegal – Part 1
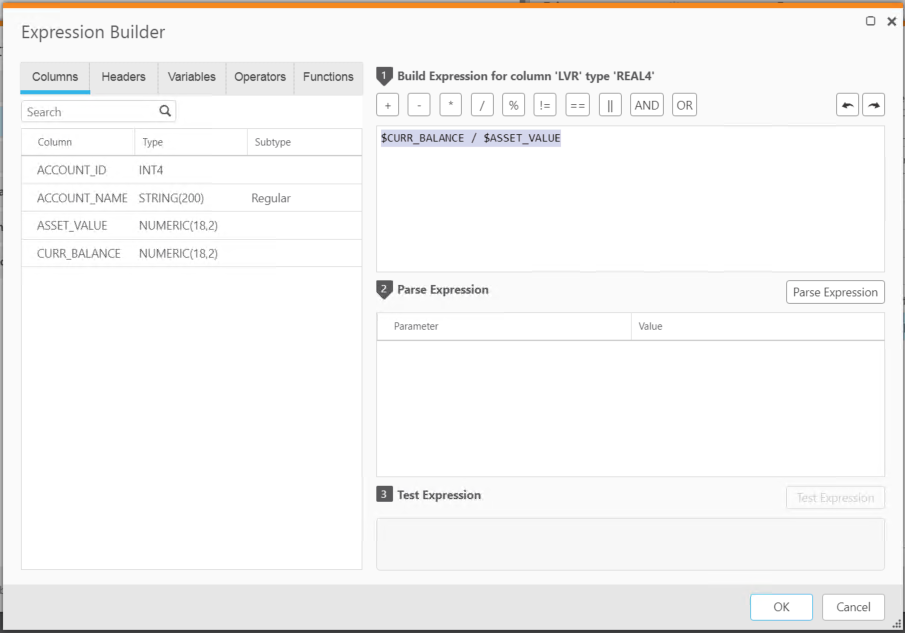
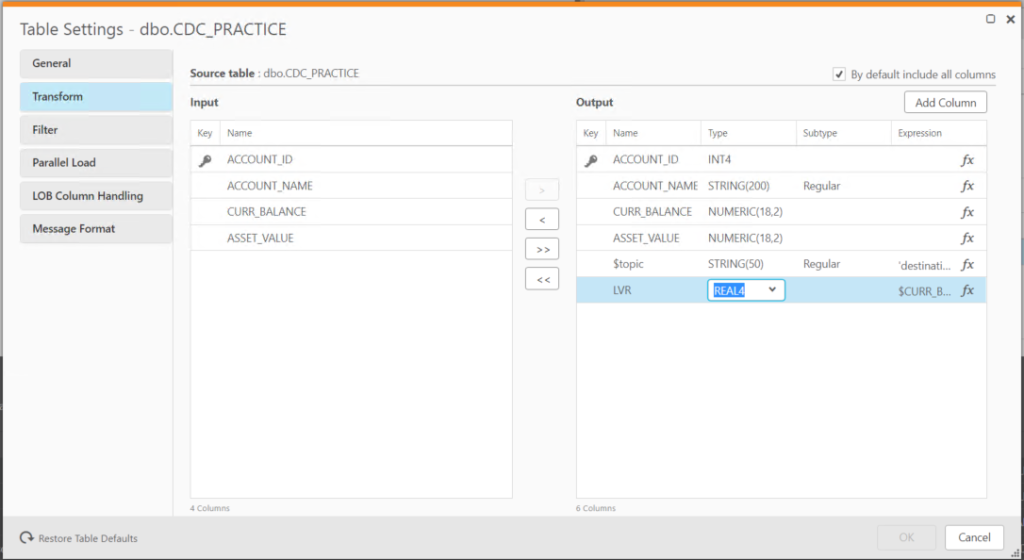
I created a simple table; with a field of CURR_BAL = 1000 and ASSET_VALUE = 0 and added a new field call LVR with the expression of:
$CURR_BALANCE / $ASSET_VALUE
Ran a full load expecting lots of nice and nasty error messages for the new team to investigate.
Hmm – no errors.
That’s not what I expected.
All the rows were transferred across and there was no errors or warnings in the log file, no data errors or anything.
I bumped up all the logging to “Trace” and reran the full load. Once again, no error messages.
Redirecting the output from the task to a kafka topic; I notice the records that had an intentional div/0 scenario was coming through as null.
Then I remembered – CDC expressions are built on sqlite syntax. Looking up how sqlite handles div/0 scenarios; by default sqlite will return a null instead of failing the query on a div/0.
It works – but forcing a precise of numeric value to a floating point data type REAL leaves me uneasy; especially in a finance world were precision is needed.
I haven’t researched or tested whether this is a risk of generating an imprecise number through a division or not; something I will need to put on my todo list.
Conclusion
My design principle for Qlik Replicate tasks is to keep them as simple as possible.
Grab the data off the source and get it to the destination as quickly as possible.
By design principle I am against putting expressions in QR tasks:
It is not as feature rich as other programming languages
It hides business rules that adds a black box and complexity to the pipeline
Point 2 was the big one for me. I didn’t want downstream users messaging me every time there was an abnormality in the data. With no expressions in the QR tasks – I could rightfully say, “QR just grabs what it finds on the source database – go and talk to them”
Now with the discovery of these little “features” that could come from expressions; and more importantly no error or warnings about these “features”; it gives me even more incentive not to program in exceptions.
QR in my eyes is not an “ETL” tool – it is just a “EL” tool.
If your designers want complex expressions and transformations programmed into their data pipelines – it should be the downstream developers task.
When doing regression testing – I need to prove that the changes that I have done to two queries returned the same result sets.
If result sets are on the same database then you can do a MINUS operator.
If not – it can be a pain to shift result sets from database to database; especially if they are large.
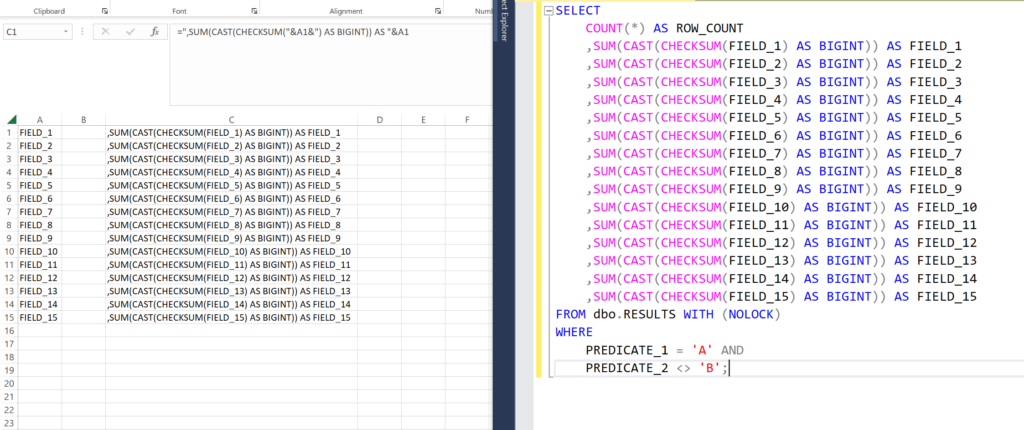
For quick and dirty testing; I like using the tsql function CHECKSUM and pl sql function ORA_HASH. It can give you some quick results to test whether a column of data has a high probability of been the same as another column.
To test a result set; I have the following excel formulas saved in my “Handy formulas” notebook:
TSQL
=",SUM(CAST(CHECKSUM("&A1&") AS BIGINT)) AS "&A1
PL/SQL
=",SUM(ORA_HASH("&A1&")) AS "&A1
With a list of column name you can then make an checksum sql statement from Excel
Running this query on both result sets; differences can be found by seeing if there is a difference in the retuned values
A work colleague asked me to do a “Mate’s rate” job for his team yesterday.
They had a MS Word document with a huge table in it that they needed to convert to Excel to load into an application.
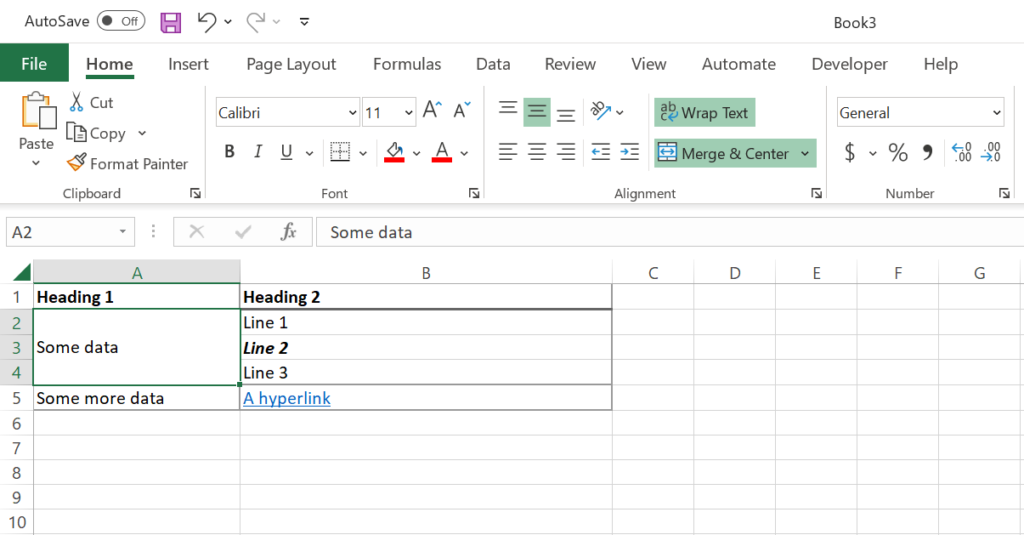
Paraphrased it looked like this:
My first thought was to copy this table out and paste it into excel to see how it looks:
Two problems:
The cell “Some data” is merged across three rows
Line 1, Line 2, Line 3 are now split across three rows instead of being in the one cell
I wrote a macro to split out the merge cells; but when it came to combining cells for Line 1, Line 2 and Line 3 I ran into a problem.
None of the usual commands and from my quick google searching could combine the cells and retained the formatting.
So commands like:
=CONCAT(B2:B4)
=B2 & B3 & B4
Would not retain the formatting; let alone add in line feed characters to make it a multiline cell
I’m sure there is a better way – but strapped for time I programmed the following subroutine in VBA
Public Sub combineCells(cell1 As Range, cell2 As Range, output As Range)
Dim formatIndex As Long
Dim formatOffset As Long
Dim hyperlink1 As String
Dim hyperlink2 As String
hyperlink1 = ""
hyperlink2 = ""
' Check if the cell has a hyperlin; but don't have a text version of the hyperlink in the Value 2
If cell1.Hyperlinks.Count <> 0 And InStr(cell1.Value2, "https:") < 1 Then
hyperlink1 = " [" & cell1.Hyperlinks(1).Address & "]"
End If
If cell2.Hyperlinks.Count <> 0 And InStr(cell2.Value2, "https:") < 1 Then
hyperlink2 = " [" & cell2.Hyperlinks(1).Address & "]"
End If
' Handling if the first cell is blank. If so we don't want a LF at the top of the cell
If Trim(cell1.Value2) <> "" Then
output.Value2 = cell1.Value2 & hyperlink1 & vbLf & cell2.Value2 & hyperlink2
formatOffset = Len(cell1.Value2) + Len(hyperlink1) + 1
Else
output.Value2 = cell2.Value2 & hyperlink2
formatOffset = Len(cell1.Value2)
End If
' Copies the formatting from cell1 to the final cell
' You can add more options to transfer over different formatting
For formatIndex = 1 To Len(cell1.Value2)
output.Characters(formatIndex, 1).Font.Bold = cell1.Characters(formatIndex, 1).Font.Bold
output.Characters(formatIndex, 1).Font.Italic = cell1.Characters(formatIndex, 1).Font.Italic
'output.Characters(formatIndex, 1).Font.Underline = cell1.Characters(formatIndex, 1).Font.Underline
Next
' Copies the formatting from cell2 to the final cell
For formatIndex = 1 To Len(cell2.Value2)
output.Characters(formatIndex + formatOffset, 1).Font.Bold = cell2.Characters(formatIndex, 1).Font.Bold
output.Characters(formatIndex + formatOffset, 1).Font.Italic = cell2.Characters(formatIndex, 1).Font.Italic
'output.Characters(formatIndex + formatOffset, 1).Font.Underline = cell2.Characters(formatIndex, 1).Font.Underline
Next
End Sub
Oh boy it runs slow – to combine a couple of thousands cells took half an hour and I had the typical worries that Excel crashed because everything was locked up.
As a business requirement of developers wanting to take advantage of new features in Qlik Enterprise Manager (QEM); we had to upgrade our system from 2021.05 to 2022.11.
This was not a smooth process and encountered several issues on the way.
First Attempt – Straight Upgrade
Simple to upgrade?
Just download the latest installer from Qlik’s website and kick it off?
Unfortunately when I gave developers keys to our dev QEM box to do the upgrade before Christmas as I was busy with other tasks.
They gave it a go without a backout plan.
Couple of days later I tried logging into the QEM console and couldn’t get on.
The AttunityEnterpriseManager service kept restarting every minute and the following errors were in the C:\Program Files\Attunity\Enterprise Manager\data\logs\EnterpriseManager.log
[START: 2023-03-01 09:40:18 Attunity EnterpriseManager Version: 2022.11.0.335]
1 2023-01-02 09:40:18 [Command ] [INFO ] Executing ServiceRunCommand command.
6 2023-01-02 09:40:19 [Host ] [INFO ] Setting up web host
6 2023-01-02 09:40:20 [Host ] [INFO ] The server will listen on the following location: http://xxxxxxx.xxx.xxx/attunityenterprisemanager
6 2023-01-02 09:40:20 [Host ] [INFO ] The server will listen on the following location: https://xxxxxx.xxx.xxx/attunityenterprisemanager
6 2023-01-02 09:40:20 [Host ] [ERROR] Object reference not set to an instance of an object.
6 2023-01-02 09:40:20 [Host ] [INFO ] Stopping service on error...
I tried the usual desperation tricks of restarting the service and then restarting the box.
In the end I had to uninstall QEM and reinstall 2021.05 as there was no backout plan.
The developers were then subsequently banned from doing anymore work on the QEM upgrade
Second attempt – Two jump upgrade
Next attempt was upgrading to 2022.05 and then jumping to 2022.11.
This time I took a backup of C:Program FilesAttunityEnterprise Managerdata so I could easily backout the change if I had problems.
The upgrade from 2021.05 to 2022.05 went smoothly; but when jumping from 2022.05 to 2022.11 the same error occurred.
I then raised a case with Qlik and also posted on their forum asking if anyone else had come across this problem.
Final Success
With help from Qlik support we developed a upgrade work around. Qlik said that there is a patch in the works as other users have had the same problem.
If you follow along – note that this method might differ for your system. In the three upgrades I have done internally; they all differed slightly.
Make sure you TEST and HAVE A BACKOUT PLAN
Upgrade Perquisites
This upgrade was done on a Windows 2019 server.
You will need:
Admin rights to QEM’s server
Licenses for QEM and Analytics
Username/Password that AEM connects to the analytics database
Privilege user account for to the analytics database
Password for the user that you use to connect QR nodes to QEM
A SQLite database client
Handy to have – an editor that can validate json format
Method
Log on to QEM console
For each server under the server tab – Right click and go to “Stop Monitoring”
Remote desktop to the QEM server
Stop the AttunityEnterpriseManager service
Back up C:\Program Files\Attunity\Enterprise Manager\data
Run the upgrade to QEM 2022.05
Once the upgrade is done; log onto QEM and ensure that version 2022.05 is working correctly
Back up C:Program FilesAttunityEnterprise Managerdata again
Stop the AttunityEnterpriseManager service again
Run following command from the command line:
cd "C:\Program Files\Attunity\Enterprise Manager\bin" aemctl repository export -f C:\temp\qem_repo_202205.json -w
Script out the postgres database with the following commands:
This is where the problem lies in our instance. Open up C:tempqem_repo_202205.json Find any code blocks with “type”: “AttunityLicense” in it and remove the whole code block.
On our dev system it was the section with “name”: “Replication Analytics”, but in prod it was section with “name”: “Replication Management”.
You may need to experiment to find the correct section
Go to Add/Remove and uninstall Enterprise manager
Once remove – delete the the folder C:\Program Files\Attunity\Enterprise Manager\data
Install QEM 2022.11. When prompted do not install Postgres
Log into QEM and check that it is up and running correctly.
Start the AEM service and check that it is running correctly
Re-add the QEM and Analytics license
Go to Settings -> Repository connections. Enter in username password set the database as cdcanalytics_2022_11_p
Intialize the repository and start the connector
Stop the AttunityEnterpriseManager service again
Open up C:\Program Files\Attunity\Enterprise Manager\data\Java\GlobalRepository.sqlite in an SQLite editor
Browse the table objects Look for name = “AnalyticsConfiguration” and modify the json value “cdcanalytics_2022_11_p” to the original analytics database name
Save SQLite database
Start the AEM service and check that it is running correctly
Go to the server tab. Edit each server and re-add the password. Click on the button “Monitor this server’s tasks and messages”. Test the connection and click OK
PVT QEM
If things go wrong
Backout process
Uninstall QEM
Delete the folder C:\Program Files\Attunity\Enterprise Manager\data
Reinstall either QEM 2021.05 or QEM 2022.05
Stop the AttunityEnterpriseManager service
Restore the appropriate backed up data folder to C:\Program Files\Attunity\Enterprise Manager\data
I swear I am working hard this close to Christmas!
But I did accidentally check in my Facebook account and saw a suspicious post that I have seen getting around the my feed.
I have seen posts like this before. A public post with a couple of dozen people tagged in it. In this case; one of the people tagged in the post was my (very nice) former girlfriend.
I have seen variations of posts like this with sunglasses and shoes; but this seems to be a new type that hit my news feed.
But this one intrigued me. The picture looks very convoluted with an image transposed over the other one. If you look carefully you can see tiled floors and other architecture. I am guessing the author did this to throw off image matching software that FB might use to match known scams or copywrite images.
Looking down the Rabbit hole
I am not a security or a web design expert but decided to check out the website.
I suspect it is a Facebook worm of some sorts.
One thing I didn’t want to do when investigating the website is either triggering off the worm propagation process and make matters even worse.
As a precaution I opened up the link in on my home computer in an incognito page with Noscript running. Last thing I wanted to do was blow up my work computer by opening a malicious link.
Here is the website in all its glory:
The short link resolved to a fuller domain name and I ran a whois check to find out more.
This actually surprised me. Other scam sites that I have checked with whois usually have domain names registered quite recently.
For instance a phishing email I got the other day – the domain name was only a day old when I looked it up in whois.
Checking out the source code behind the site – the actual HTML code was very neat and tidy. Nice – I like well formed code.
Other things I noted:
All the main menu links will jump to a particular spot on the page. This will link off to another website where you can enter in contact details like name, address, phone, credit card number etc. I didn’t go in deeper than this to see the response of putting in fake details as this was out of my depth.
There were Chinese characters in the html comments. This by no means implying that people who write comments in Chinese are dodgy – but seems a unusual a “US Today” website would have foreign language comments in it.
Image searching
The website was filled with “Before and After” images and testimonies on their product.
The author of this website actually got the photo off Shutterstock that she referenced (link broken) on the website
Summary
A proper web developer and security expert can probably pull apart this website and explain how the malicious part of it work – but I am not at that level.
One of the biggest risks to security is the component that sits between the computer keyboard and the chair.
For all the diving into the code, checking domains and looking up reused images over the past half an hour; the biggest thing that stood out to me is the language in the Facebook post:
“I use it. I didn’t change my diet or exercise. Photos before and after use”
It doesn’t seem right. The post is very vague.
What did she use? Why isn’t there more details?
If she lost a heap of weight; wouldn’t her language be prouder?
More descriptive?
Wouldn’t she be showing photos of herself instead of some convoluted photo?
Why is my former girlfriend tagged in this post? She’s doesn’t have the personality to use questionable diet products. If the poster is her friend – would she really share something in this manner? If it was for my former girlfriend – why not send it in a private message or a group chat?
Don’t make hacker’s lives easy. Think before you click.
A nice quiet evening with the family was interrupted with a critical alert coming through my phone.
Once again server patching had knocked off our Qlik Replicate node.
Logging in I could see that Enterprise manager could not reach one of our nodes with the following error message in the log:
2022-12-15 19:15:40 [ServerDto ] [ERROR] Test connection failed for server:MY_QR_CLUSTER. Message:'Unable to connect to the remote serverA connection attempt failed because the connected party did not properly respond after a period of time, or established connection failed because connected host has failed to respond xxx.xxx.xxx.xxx:443'.
I have seen this problem before and it is usually resolved by:
Failing over the QR windows cluster
Restarting the new passive node
Our IT team is aware of the problem and have been researching into a cause and a fix. Their prevailing theory was that when the cluster gets failed over in server patching – there are some residual connections to the previous active node.
But tonight after multiple failovers and stopping and starting the QR roles – still Enterprise manager couldn’t connect to that QR node.
I did the following checks:
The log repsrv.log log file had no error messages and the service Web UI service was active
From the Enterprise manager; I could ping the QR cluster address and the active node successfully
From a Chrome session on the Enterprise manager server; I could not get to the QR Web console
From a Chrome session on the QR server; I could get to the QR Web console
A senior IT member joined the troubleshooting call and suggested that we reboot the Enterprise manager server.
So we did and then we couldn’t access Enterprise manager console.
At this point I wanted to quit IT and become a nomad in Mongolia.
Then the senior IT member worked it out.
The Windows server was randomly turning on the Windows Firewall
This was blocking our inbound connections; making the console inaccessible from other locations – except when you were logged onto the server.
This also explains why when this problem previously arise; restarting the server will eventually work because the server group policy will eventually get applied and turn off the Windows firewall.
Lessons learnt
If you come above this problem in your environment try accessing the QR console from multiple locations:
From the Enterprise Manager server
From within the QR server with a local address like: https://localhost/attunityreplicate/login/