A member of our Fraud team contacted me unexpectedly at work.
Hey. I got this excel workbook of a customer’s statement with the data spread across multiple sheets. Do you know how to consolidate them into one sheet?
“OK,” I thought, “It can’t be that hard.”
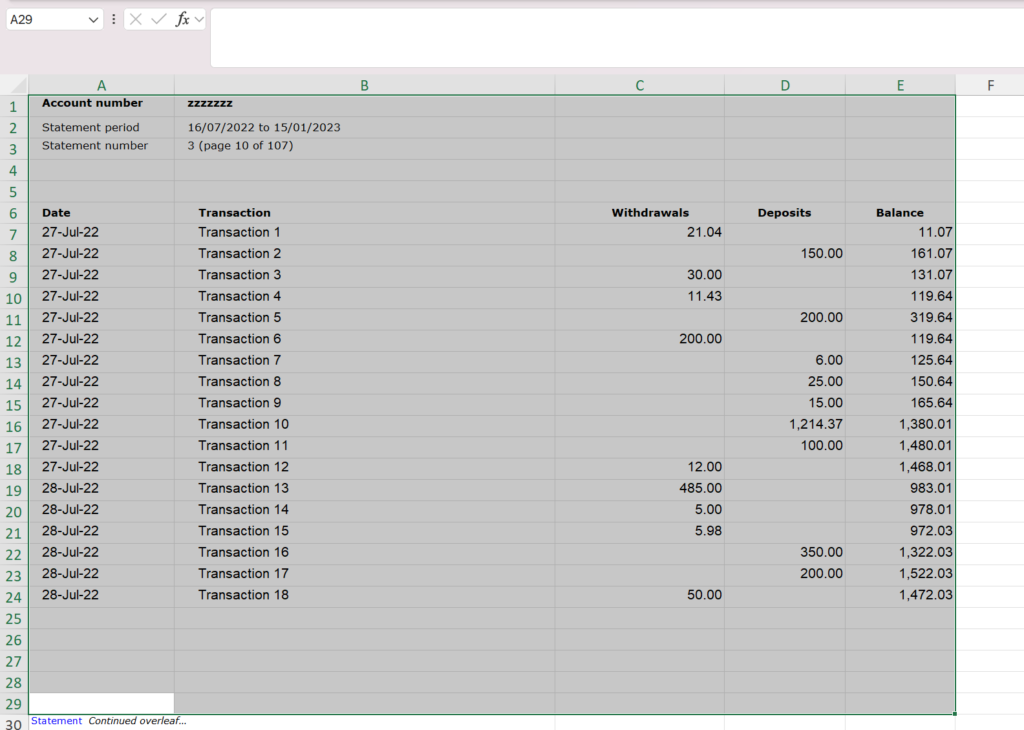
She sent me the workbook. It had 447 sheets in it! The statement was initially in a PDF format and the Fraud team exported it to Excel. This resulted in a sheet for each page; looking like this:
The data that we were interested in was between A7 and E29 on each page. I visually spot checked half a dozen sheets across the workbook and they were in similar format
Ditching VBA for openpyxl
In yesteryear; I would have VBA inside Excel to consolidate the sheets. But I felt it was time to grow up from VBA and see what python had to offer.
It was surprisingly quick and easy to program up. I honestly thought it would have taken me as long; if not longer in VBA.
Here is the scratch code for your perusal
import openpyxl
import logging
from datetime import datetime
import csv

# Formats a row into a format for the delimited file
def format_row(in_record):

    try:
        in_record[0] = datetime.strftime(in_record[0], "%Y-%m-%d")  # Converts the python date to YYYY-MM-DD
    except TypeError as e:
        root_logger.warning("Cannot convert " + in_record[0] + " to date/time")

    in_record[1] = in_record[1].replace("\n", " \u21B5")    # Adds in a return arrow

    if in_record[2] == None:
        in_record[2] = ""

    if in_record[3] == None:
        in_record[3] = ""

    return in_record


if __name__ == '__main__':

    now = datetime.now()

    log_formatter = logging.Formatter("%(asctime)s [%(threadName)-12.12s] [%(levelname)-8.8s]  %(message)s")
    root_logger = logging.getLogger()
    root_logger.setLevel(logging.INFO)

    log_console_handler = logging.StreamHandler()
    log_console_handler.setFormatter(log_formatter)
    root_logger.addHandler(log_console_handler)

    final_array = []

    wb = openpyxl.load_workbook("CONSOLIDATEDExcel.xlsx")

    for focus_sheet_name in wb.sheetnames:

        root_logger.info("Processing sheet: " + focus_sheet_name)

        focus_sheet = wb[focus_sheet_name]
        root_logger.debug("Total number of rows: " + str(focus_sheet.max_row) + '. And total number of columns: ' + str(focus_sheet.max_column))


        if focus_sheet["A6"].value == "Date":   # Checks for the key field "Date" in position A6

            my_list = []

            for sheet_row in focus_sheet.iter_rows(
                min_row=7, max_row=26, min_col=1, max_col=5,    # Gets specific section of the worksheet
                values_only=True):

                sheet_row_list = list(sheet_row)

                if sheet_row_list[0] != None:   # Ignore lines that are blank
                    final_array.append(format_row(sheet_row_list))
        else:
            root_logger.info("Cannot find key column \"DATE\".  Skipping sheet")


    # Output records to a tab delimited file
    with open("Consolidated_output.tab", 'w', newline='', encoding="utf-8") as myfile:
        wr = csv.writer(myfile, quoting=csv.QUOTE_ALL, delimiter="\t")
        wr.writerows(final_array)
Also; it ran blindingly quick – as quick as I feel in VBA with Application.ScreenUpdating = False
Anyway; Fraud team was happy I turned their request around quickly. I’m guessing if the fraud team is involved – someone is about to have a bad day.
Let’s see if we can get them talking to each other
Working on Postgres Config files
First modification is needed is to the postgresql.conf for the postgres docker image. If you were following the docker-compose.yml in my previous post; you can find the file under:
~/apps/postgres-plv8/postgresql.conf
The following changes need to be made in postgresql.conf as found in the Qlik documentation
wal_level = logical
max_replication_slots = 3       # max number of replication slots
Now to added the following lines to
~/apps/postgres-plv8/pg_hba.conf
# Allow replication connections from localhost, by a user with the
# replication privilege.
local   replication     all                                     trust
host    replication     all             127.0.0.1/32            trust
host    replication     all             ::1/128                 trust
Once done – the docker container needs to be restarted for the changes to take effect.
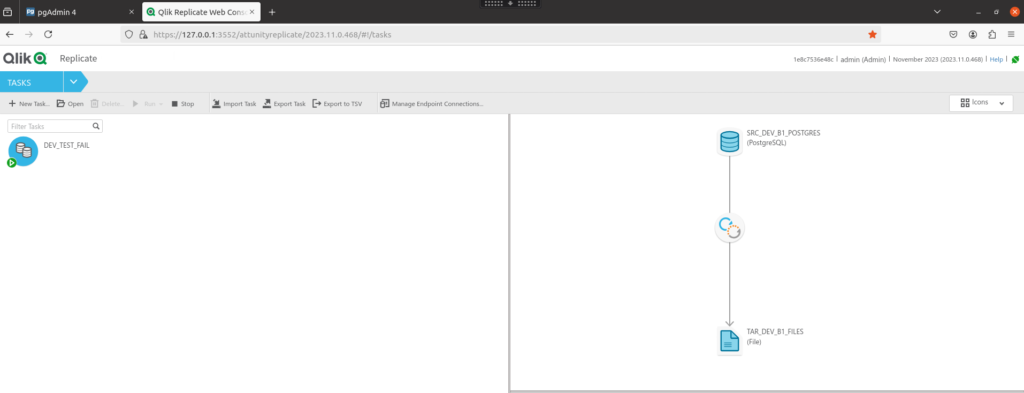
Setting up QR
Log into QR using the address:
https://127.0.0.1:3552/attunityreplicate
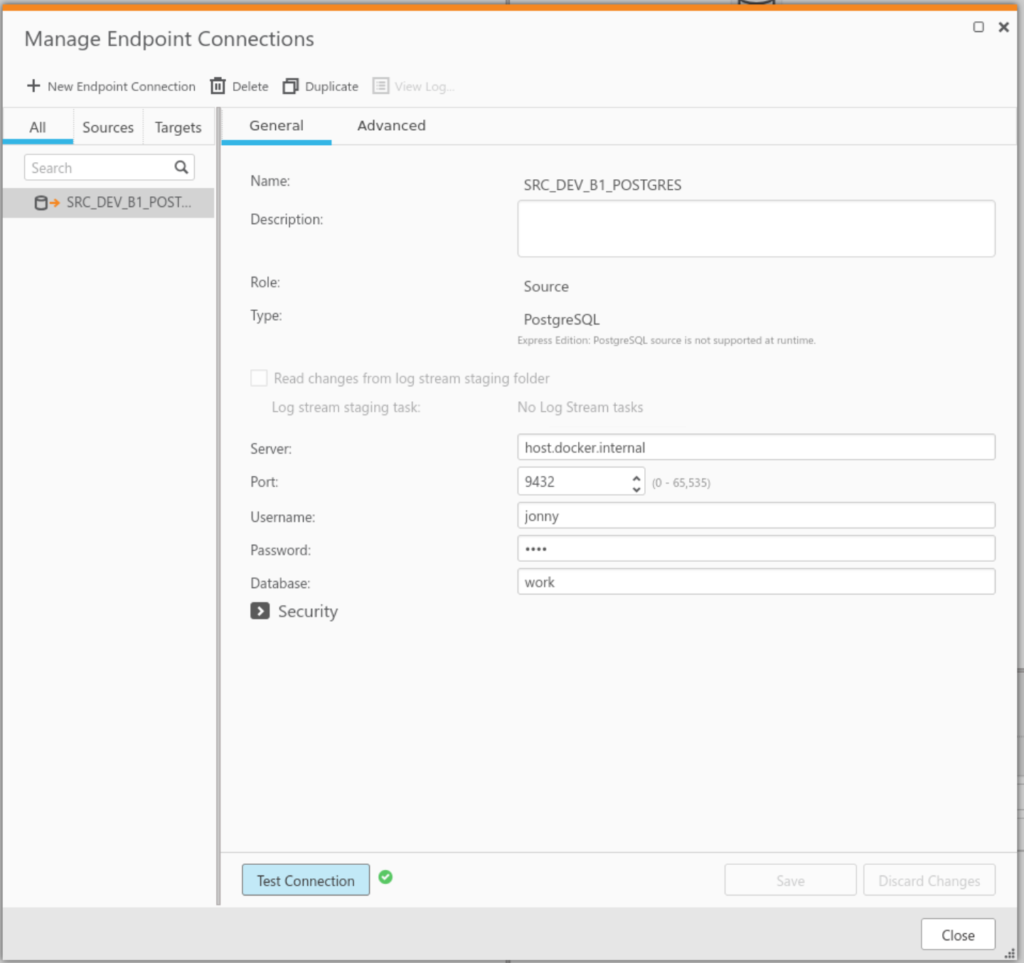
Create a new postgres connection
Fill out the following fields:
Field
Value
Server
host.docker.internal
Port
9432
Username
Username from the docker-compose.yml file for postgres
Password
Password from the docker-compose.yml for postgres
Database
Database from docker-compose.yml for postgres
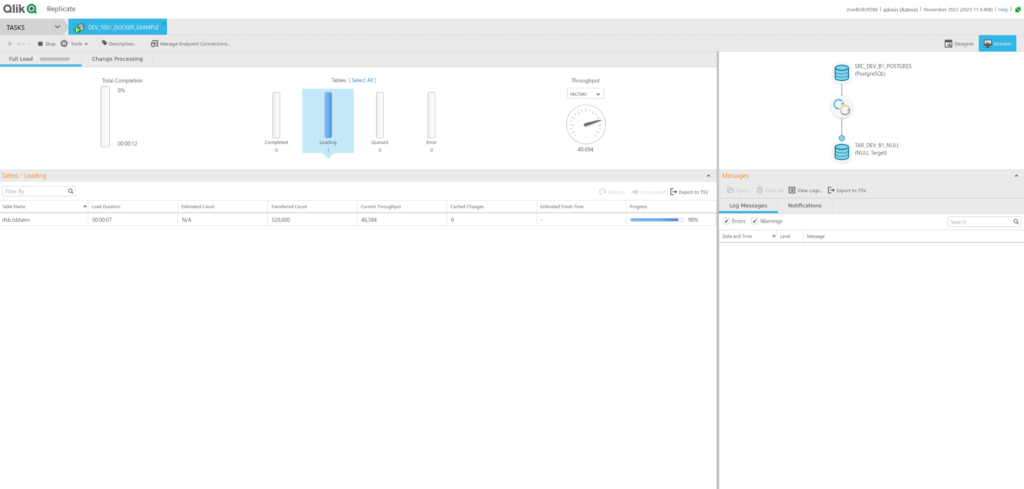
From here a QR task can be built to read from the postgres database
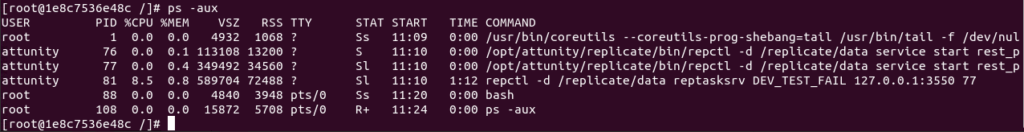
This error gives us problems; I can’t resume the task as the error re-appears. I can’t even start it from the stream position and must rely on restarting the QR task from a timestamp, which is extremely dangerous with the chance of missing out on data for that split of a second.
I suspect the problem is that the “staging” file on the QR server gets corrupted mid write when the server fails and when resume; QR can’t parse it.
But trying to recreate the problem in a safe environment to diagnose it is tricky. Our DTL environment doesn’t create enough traffic to trigger the issue. Also, I don’t want to be abruptly turning off our DTL QR servers and interrupting other people’s testing. As for trying to recreate the problem in production – the pain of all the red tape is not worth the effort.
I needed a safer space to work in. A space when I can pump through large volumes of data through QR and kick the QR service around trying to provoke the error. Armed with my little Linux VM – docker containers was the answer.
CentOS? Why CentOS?
My goal was to build a Docker container with Qlik Replicate and Postgres drivers so I can use it on my Linux VM.
Following the instructions I ran into some initial problems. The first major problem was using the Cent OS docker image. The issue was that I must use the packages in my company’s artifactory and not external packages. Although the company had CentOS; there was no other packages available to update and install. Since my VM cannot reach http://vault.centos.org; the CentOS image was a lame duck.
With CentOS off the cards, I had to use Redhat image that my company provided. With Redhat – the artifactory had all the packages that I needed.
The second problem was that I was wanting to use the 2023.11 image to match our environment. With 2023.11 there are some extra steps needed in the docker file compared to 2024.05. The differences is notated on Qlik’s support article.
The Dockerfile
Here is the Dockerfile
FROM my.companys.repo/redhat/ubi9


ENV QLIK_REPLICATE_BASE_DIR=/opt/attunity/replicate/
ENV ReplicateDataFolder=/replicate/data
ENV ReplicateAdminPassword=AB1gL0ngPa33w0rd
ENV ReplicateRestPort=3552
ENV LicenseFile=/tmp/replicate_license_exp2025-06-29_ser60038556.txt

# Copy across installation packages and licenses
ADD postgresql*.rpm /tmp/
ADD areplicate-*.rpm /tmp/
ADD systemctl /usr/sbin
ADD replicate_license_exp2025-06-29_ser60038556.txt /tmp/

# Update packages
RUN dnf -y update
RUN dnf makecache

# To get ps command
RUN dnf -y install procps-ng
RUN dnf -y install unixODBC unzip
RUN dnf -y install libicu.x86_64
RUN rm -f /etc/odbcinst.ini

# Installing posgres packages
RUN rpm -ivh /tmp/postgresql13-libs-13.9-1PGDG.rhel9.x86_64.rpm
RUN rpm -ivh /tmp/postgresql13-odbc-13.02.0000-2PGDG.rhel9.x86_64.rpm
RUN rpm -ivh /tmp/postgresql13-13.9-1PGDG.rhel9.x86_64.rpm

ADD odbcinst.ini /etc/

# Installing Qlik Replicate
RUN systemd=no yum -y install /tmp/areplicate-2023.11.0-468.x86_64.rpm
RUN yum clean all
RUN rm -f /tmp/areplicate-*.rpm

RUN export LD_LIBRARY_PATH=/opt/attunity/replicate/lib:\$LD_LIBRARY_PATH
RUN echo "export LD_LIBRARY_PATH=/usr/pgsql-13/lib:\$LD_LIBRARY_PATH" >> /opt/attunity/replicate/bin/site_arep_login.sh

ADD start_replicate.sh /opt/attunity/replicate/bin/start_replicate.sh
RUN chmod 775 /opt/attunity/replicate/bin/start_replicate.sh
RUN chown attunity:attunity /opt/attunity/replicate/bin/start_replicate.sh
RUN source $QLIK_REPLICATE_BASE_DIR/bin/arep_login.sh >>~attunity/.bash_profile
ENTRYPOINT /opt/attunity/replicate/bin/start_replicate.sh ${ReplicateDataFolder} ${ReplicateAdminPassword} ${ReplicateRestPort} ${LicenseFile} ; tail -f /dev/null
The postgres packages can be obtained from https://download.postgresql.org/pub/repos/yum/13/redhat/rhel-9-x86_64/
I quite often you hear recipes described as “scrumptious” or “moreish” and these terms are thrown around by people with poor impulse control.
I describe this recipe as “Dangerous.” Dangerously addictive. And I don’t use this term lightly. I’m surprised there isn’t a “Drug & Alcohol” article released on the dangers of these Sausage rolls
Before COVID in the office morning tea, the original owner of the recipe would bring a batch of sausage rolls in and they will be the first plate of food eaten.
I cooked a batch for a 4 yo birthday party and people were fighting over to get the last one.
My kid’s friends devoured a whole container of sausage rolls after school, leaving none for tea that night.
When the original recipe owner gave me the recipe; surprisingly there is nothing remarkable about the ingredients. No rare or exotic ingredients need to be sourced from far distant lands. No illicit drugs folded in. No magic or rituals to add to the quality.
Anyway – without further ado; here is the recipe of “Little Ash’s ‘Dangerous’ sausage rolls.”
The Recipe
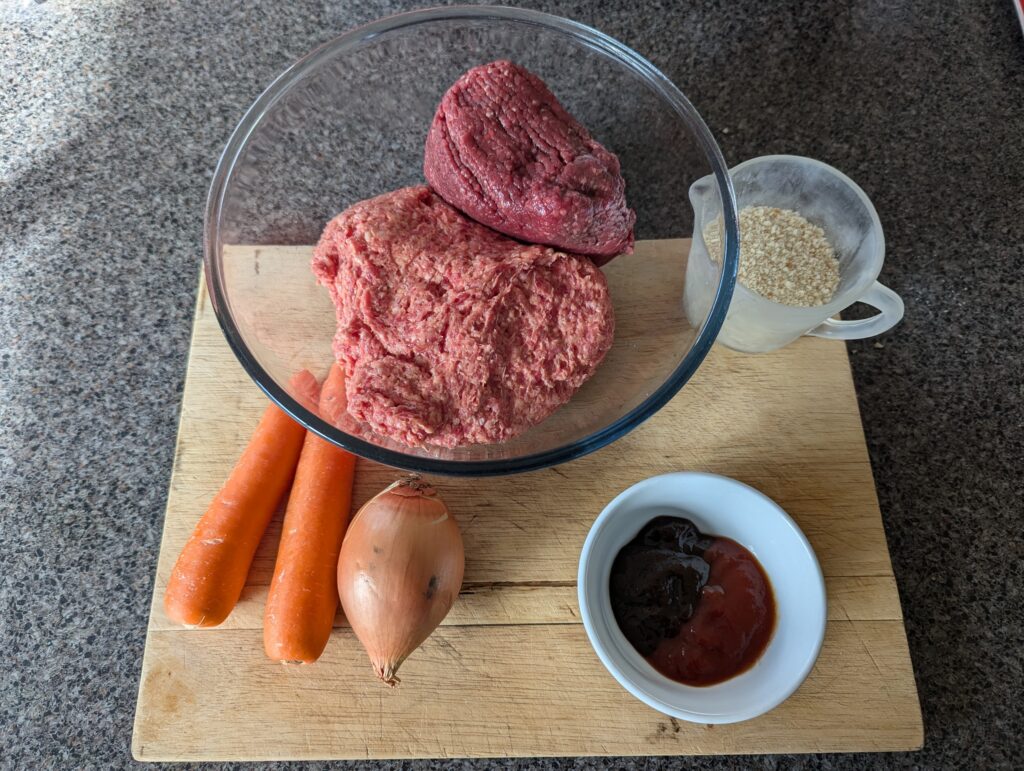
Ingredients
500g Sausage mince
500g Beef mince
1 onion (diced fine)
2 carrots (finely grated)
2/3 cup bread crumbs
2tbs Tomato sauce
2tbs Nice BBQ sauce
1tsp Garlic powder
Sprinkle of mixed herbs
Pepper to taste
6 sheets of puff pastry (20cm x 20cm)
Beaten egg + 1tbs of milk for glazing
Method
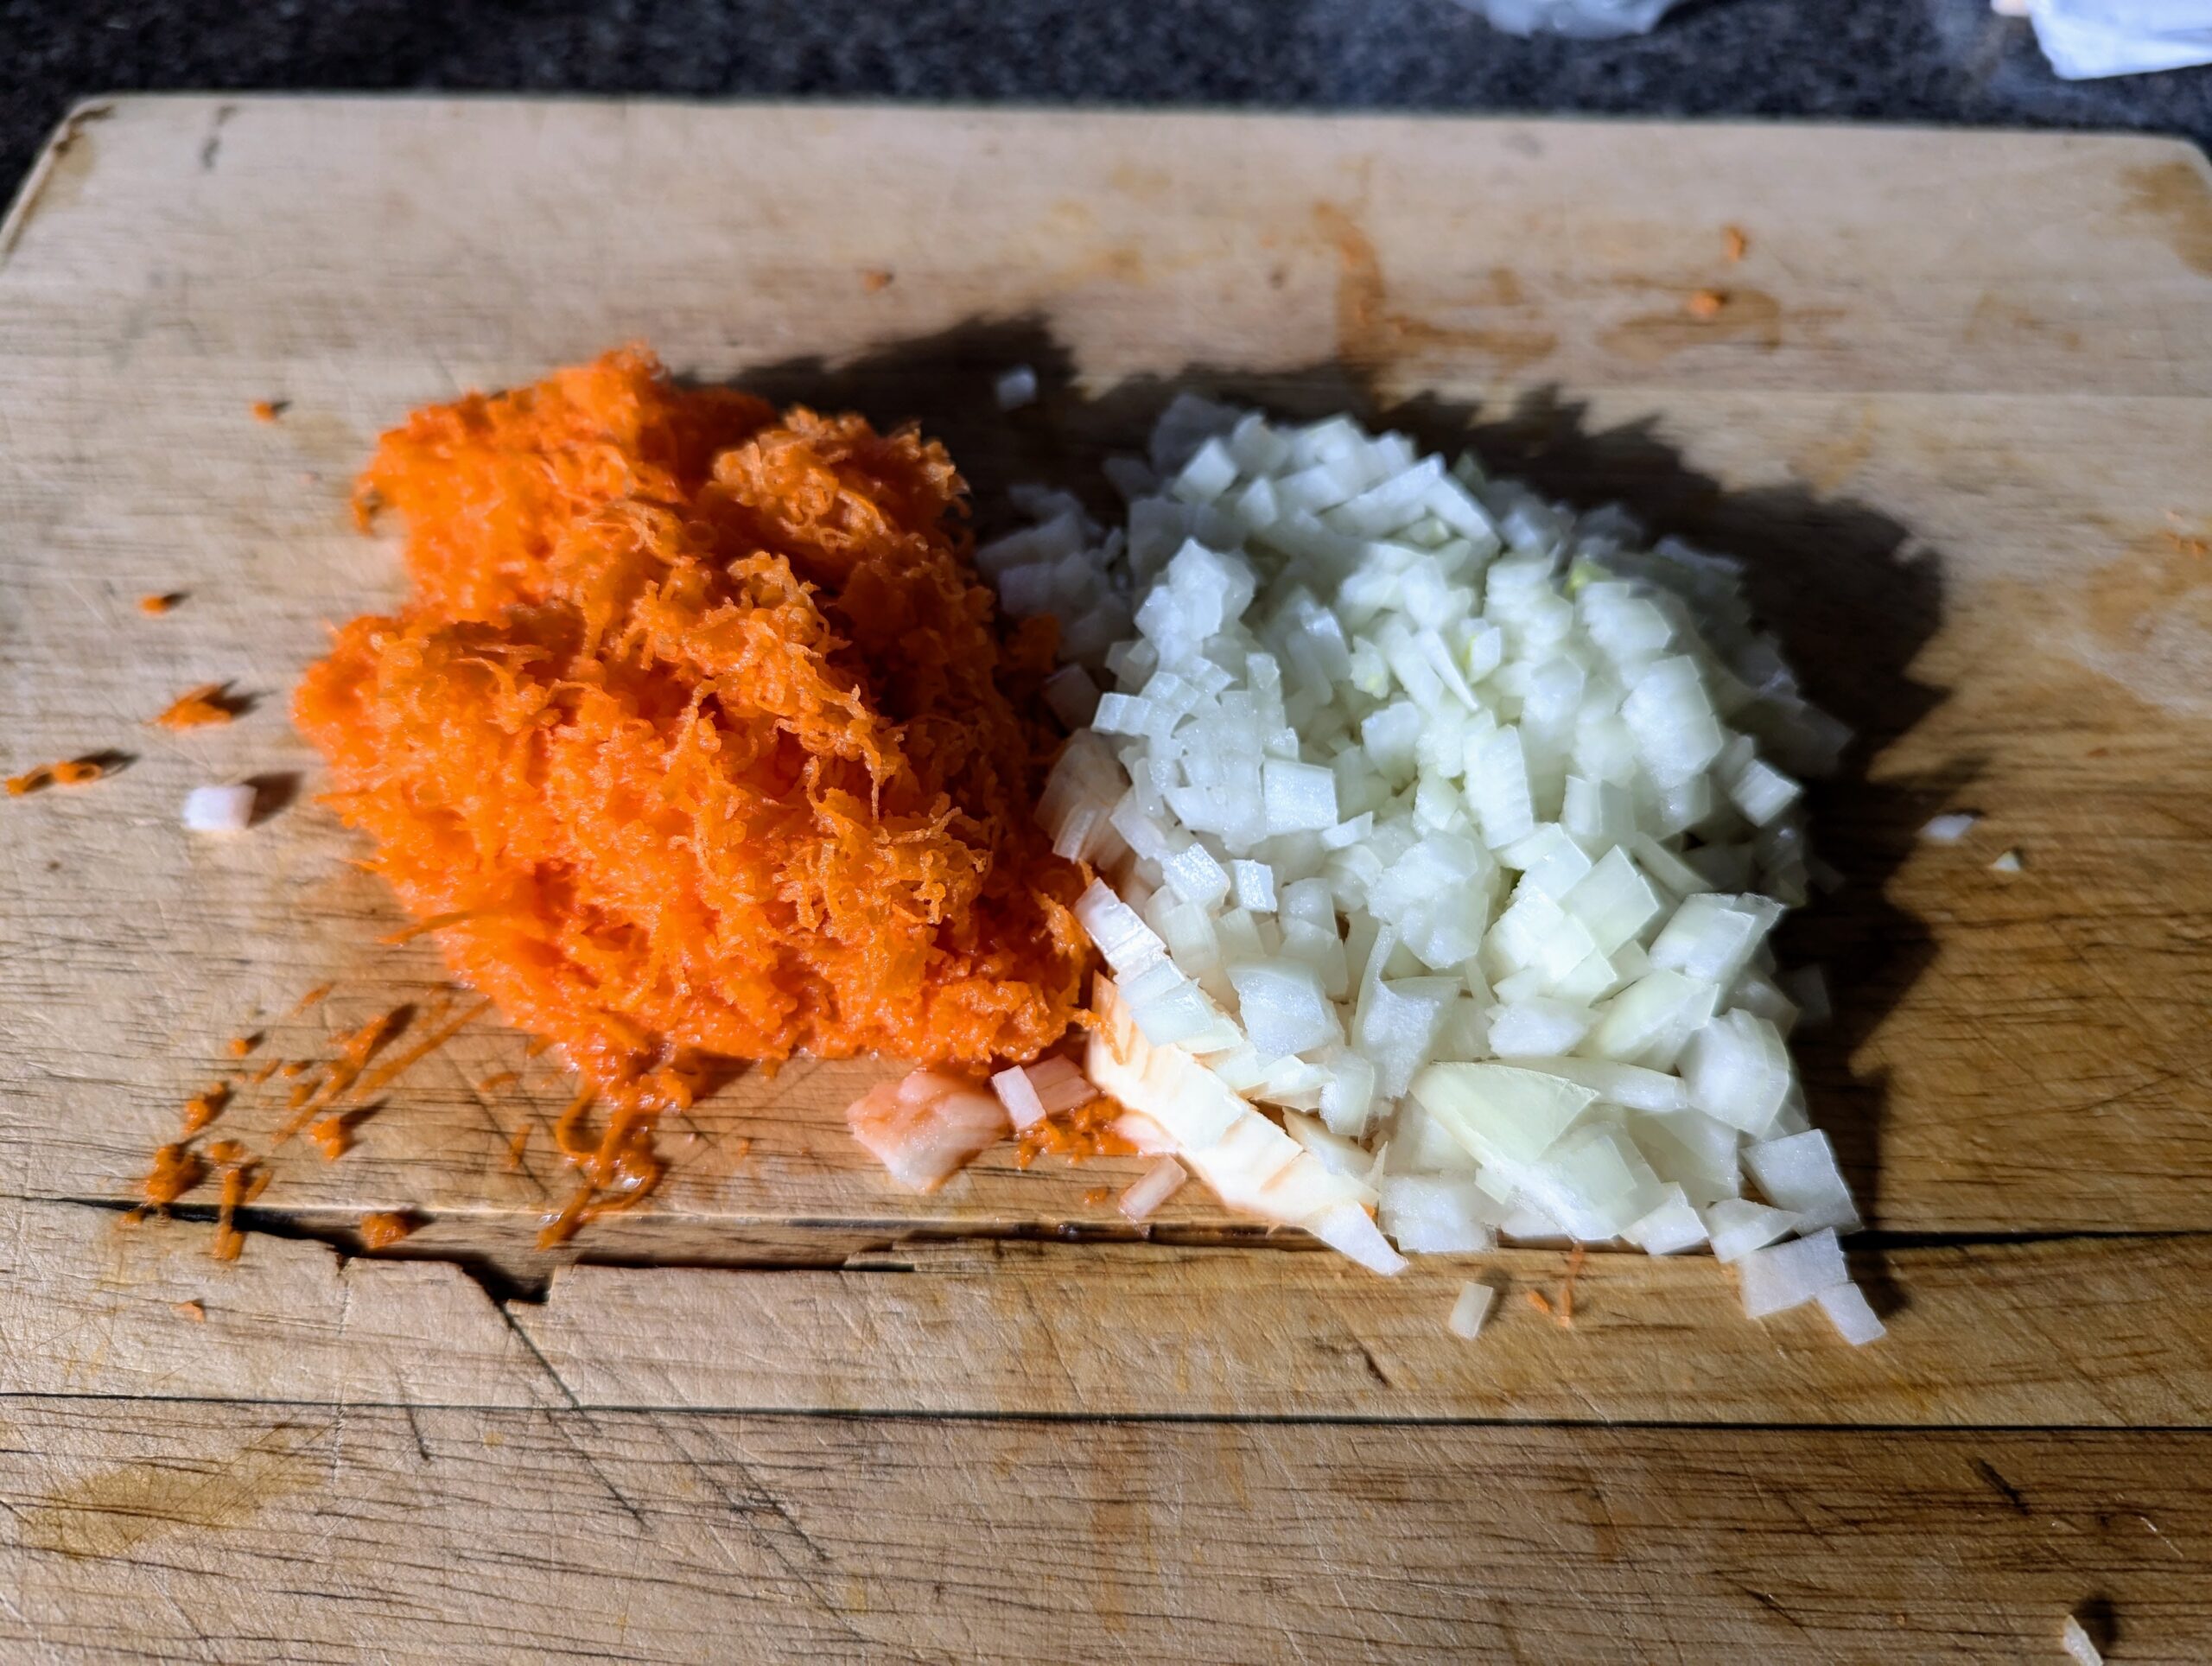
Dice the onion up as finely as possible
Grate the carrots in the small holes in the grater
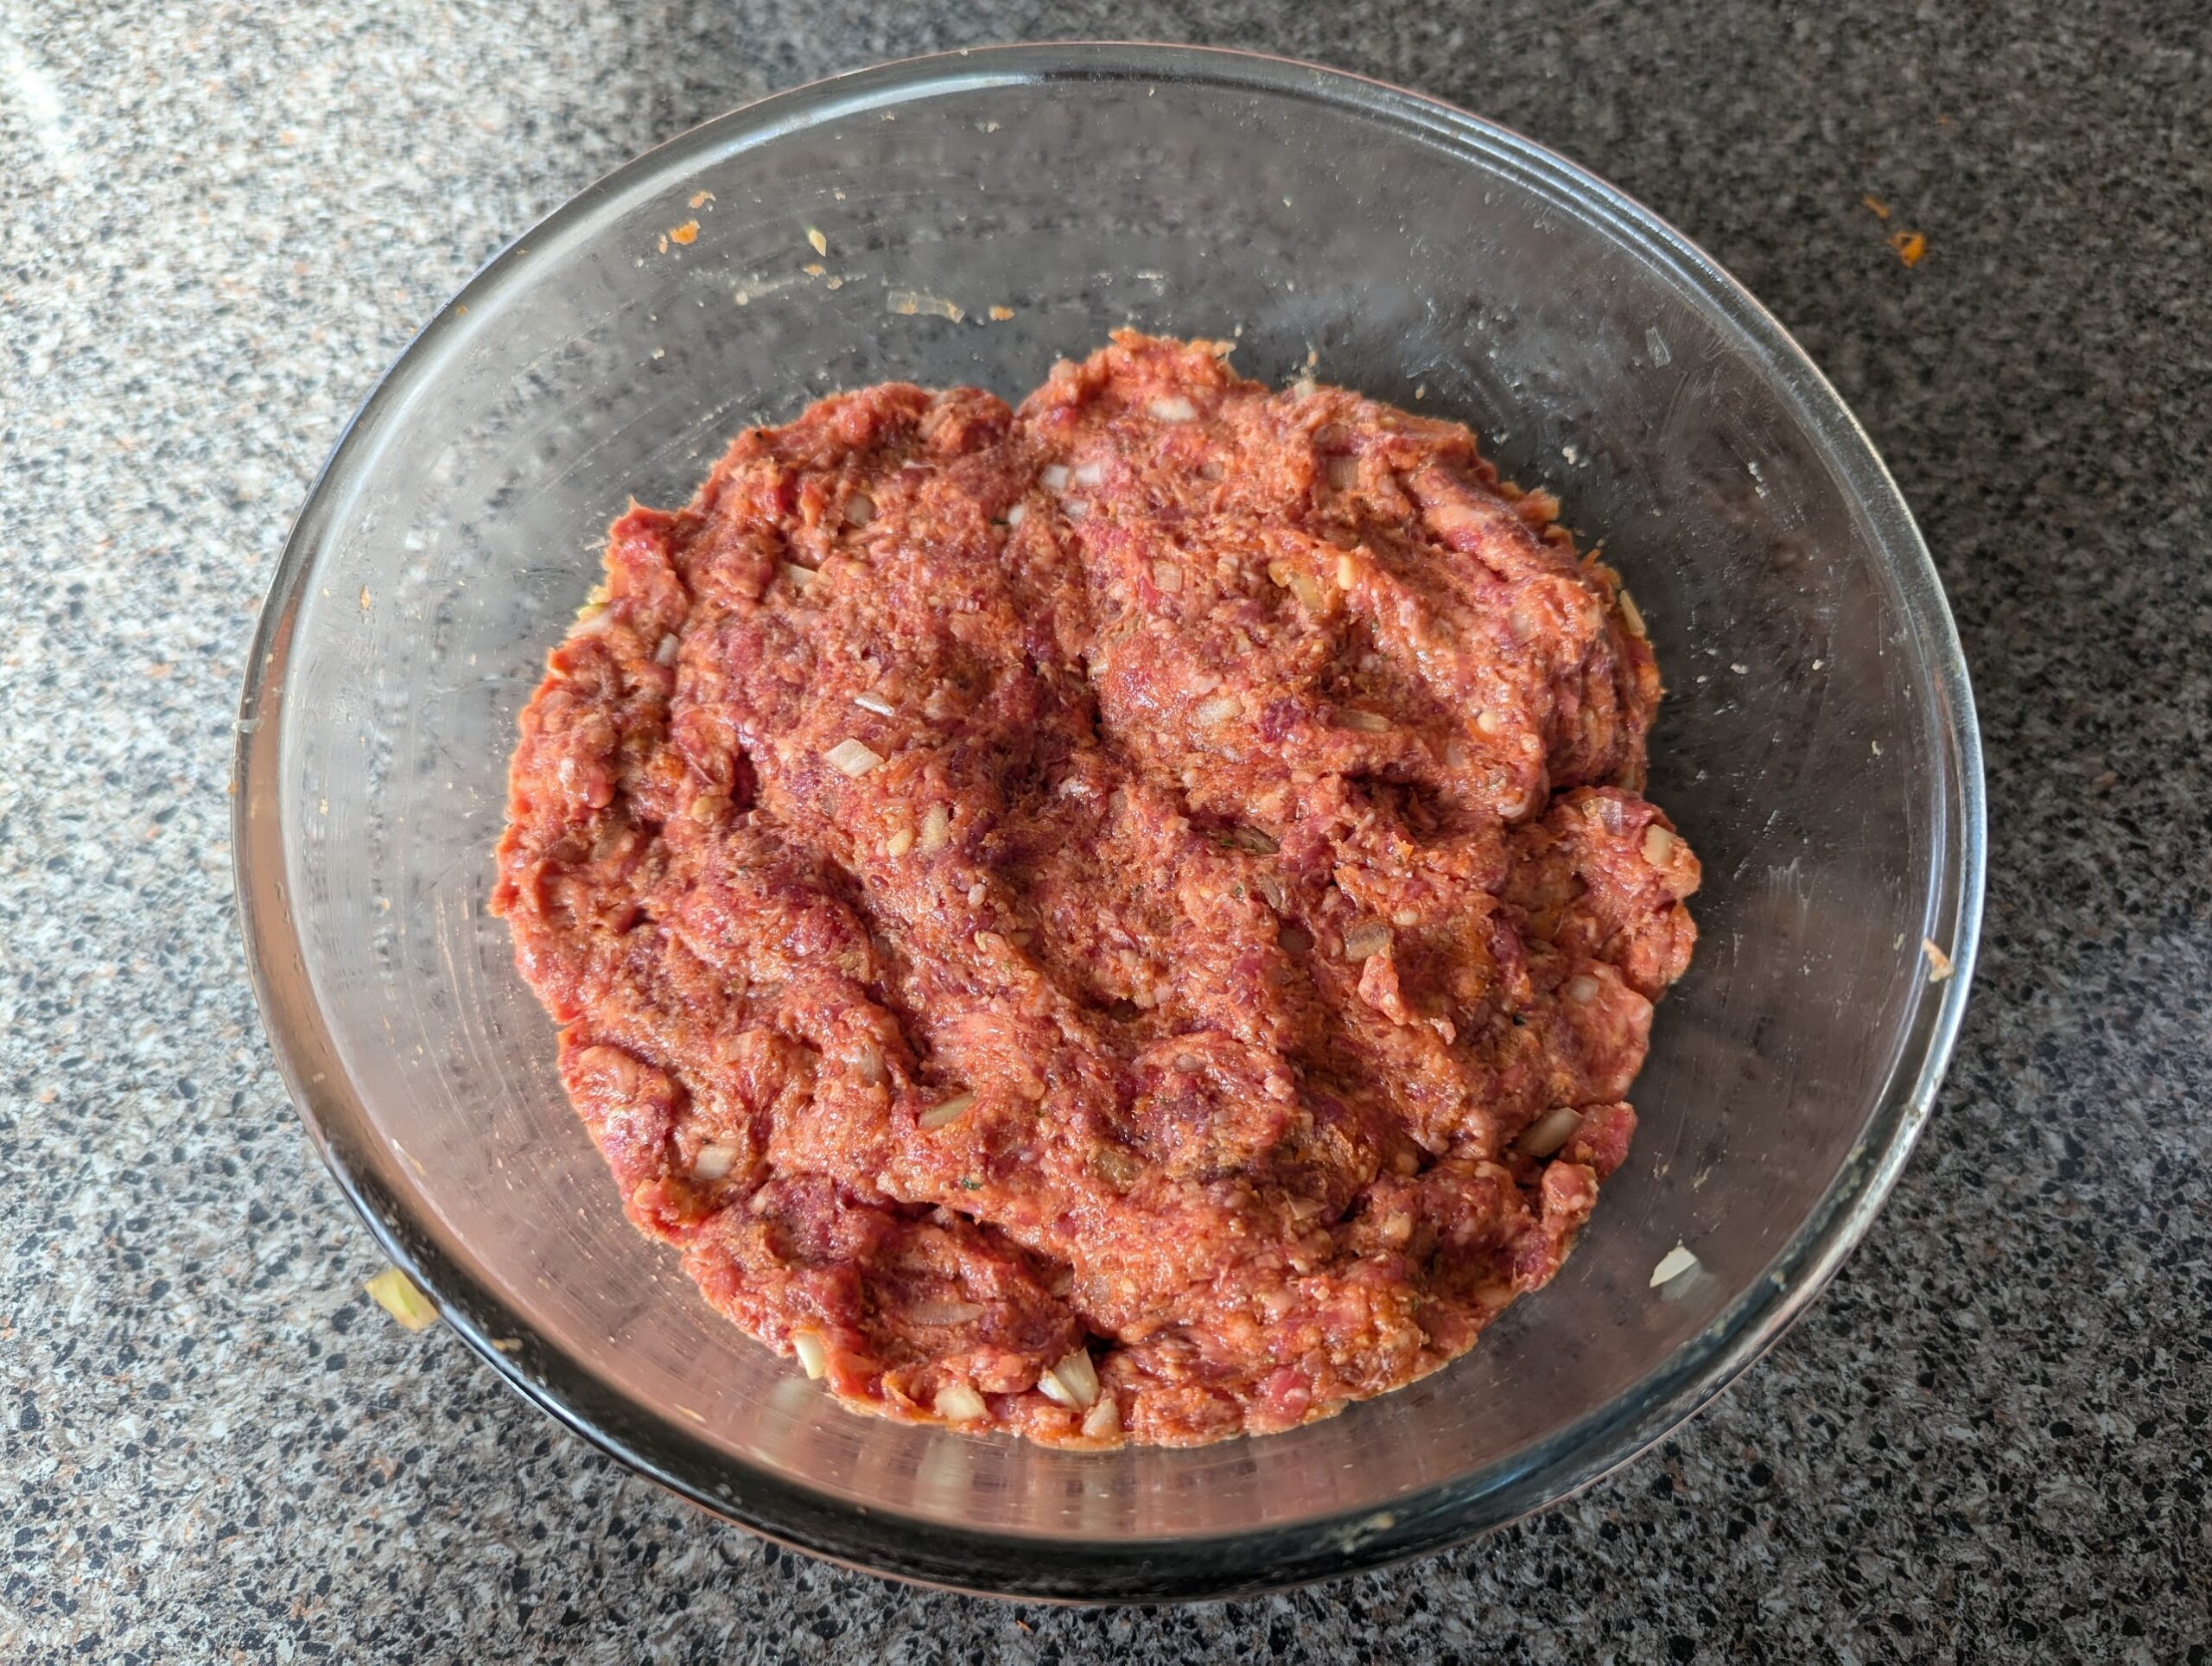
Mix all the ingredients together in a large bowl; ensuring they are all evenly distributed. I use clean hands to do this.
Cover with gladwrap and allow mixture to rest for an hour in the fridge. I actually leave the mixture overnight for the flavours to develop further.
Preheat a fan forced oven to 200c
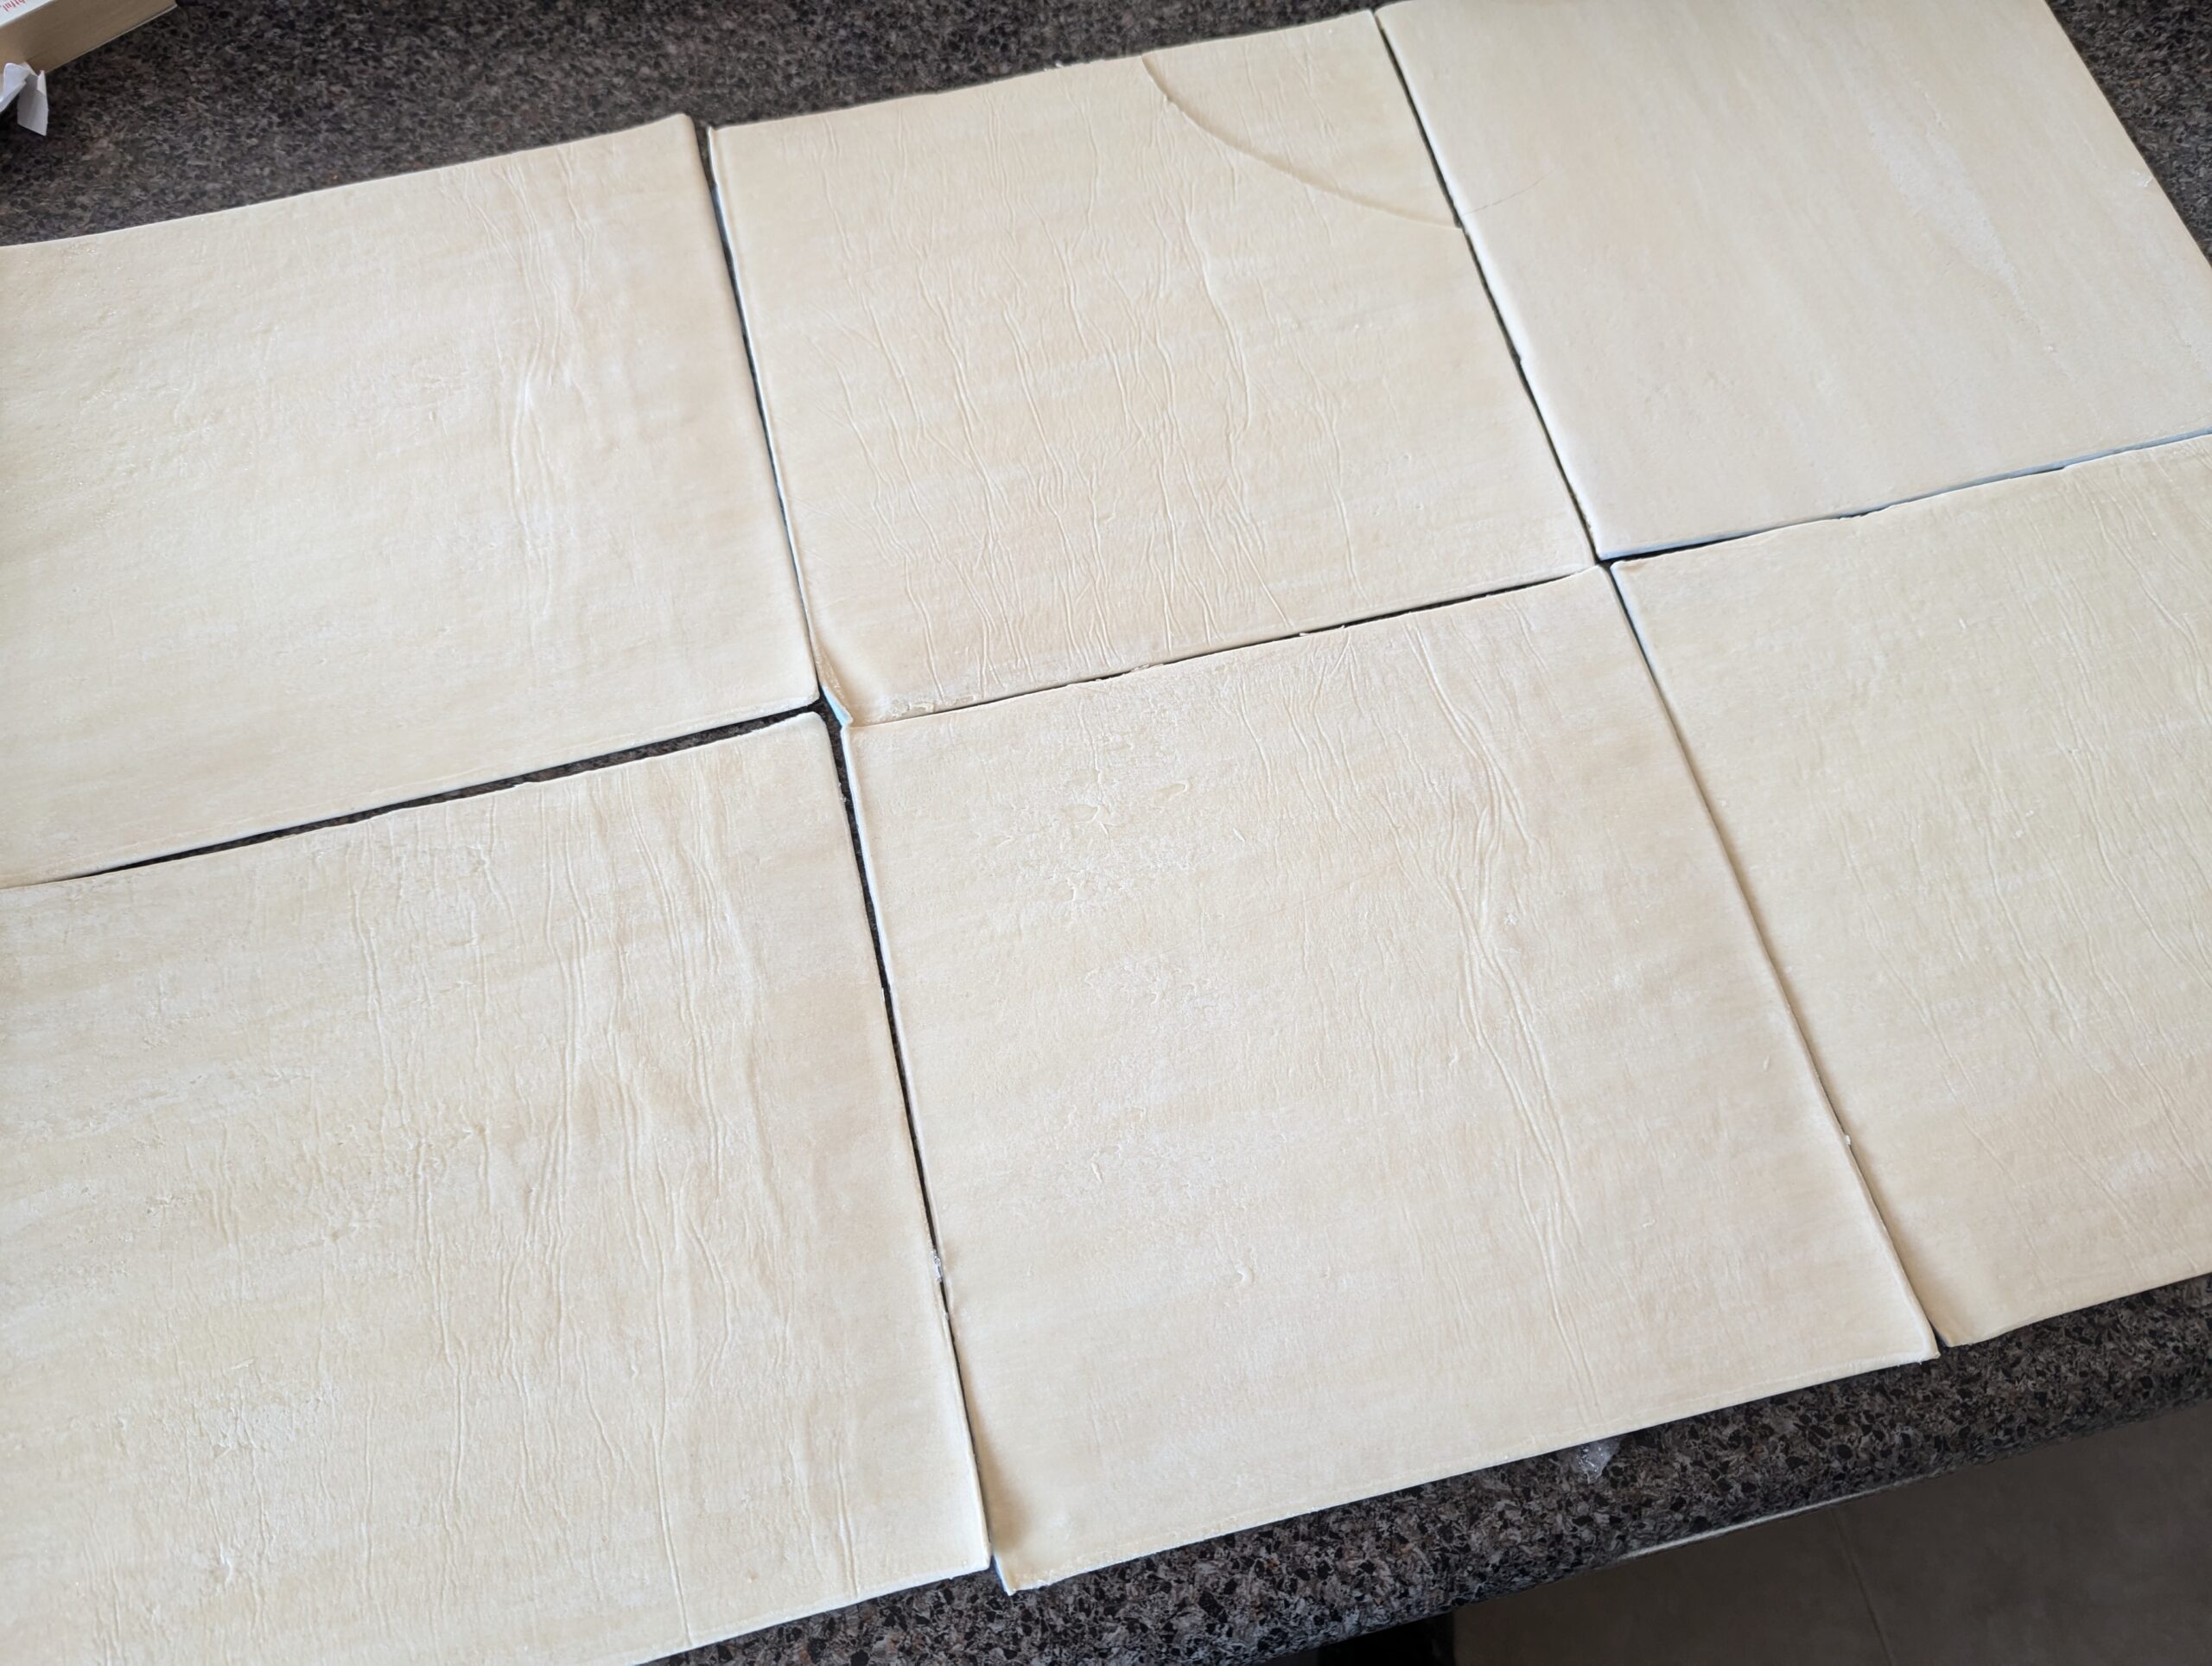
Lay out six sheets of Puff pastry to allow to thaw so it can be worked with
Cut each piece of pasty in half.
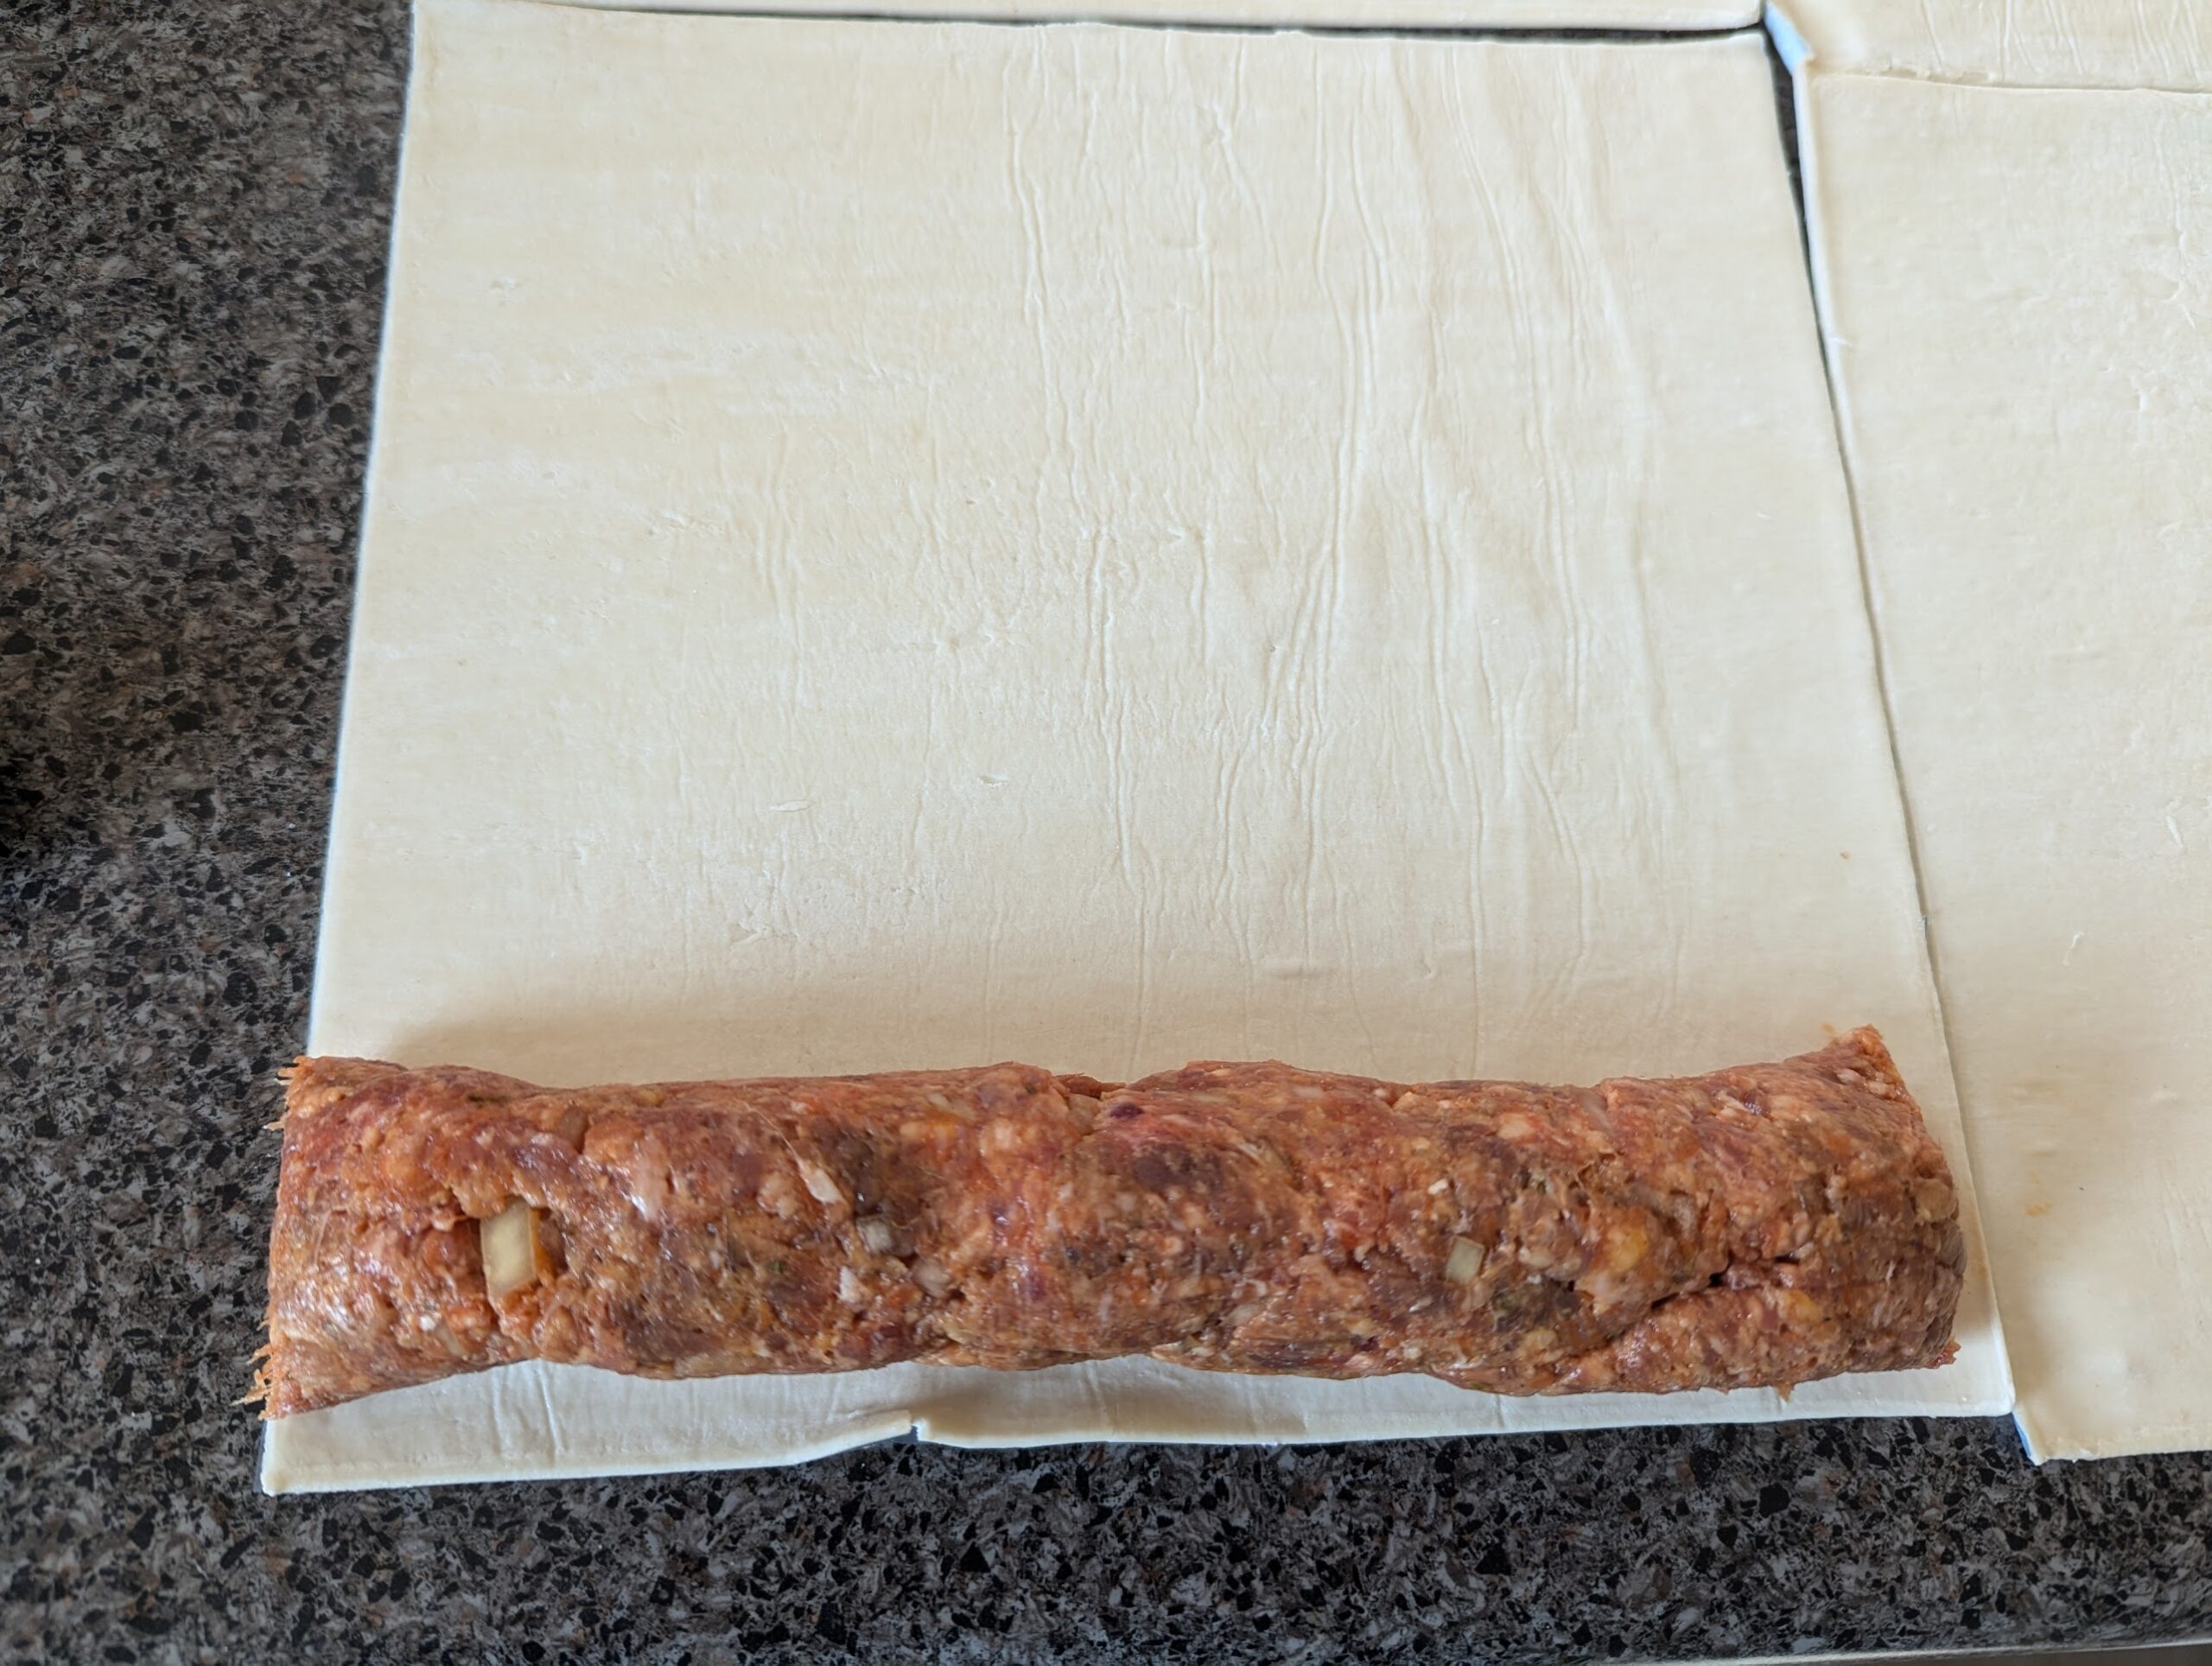
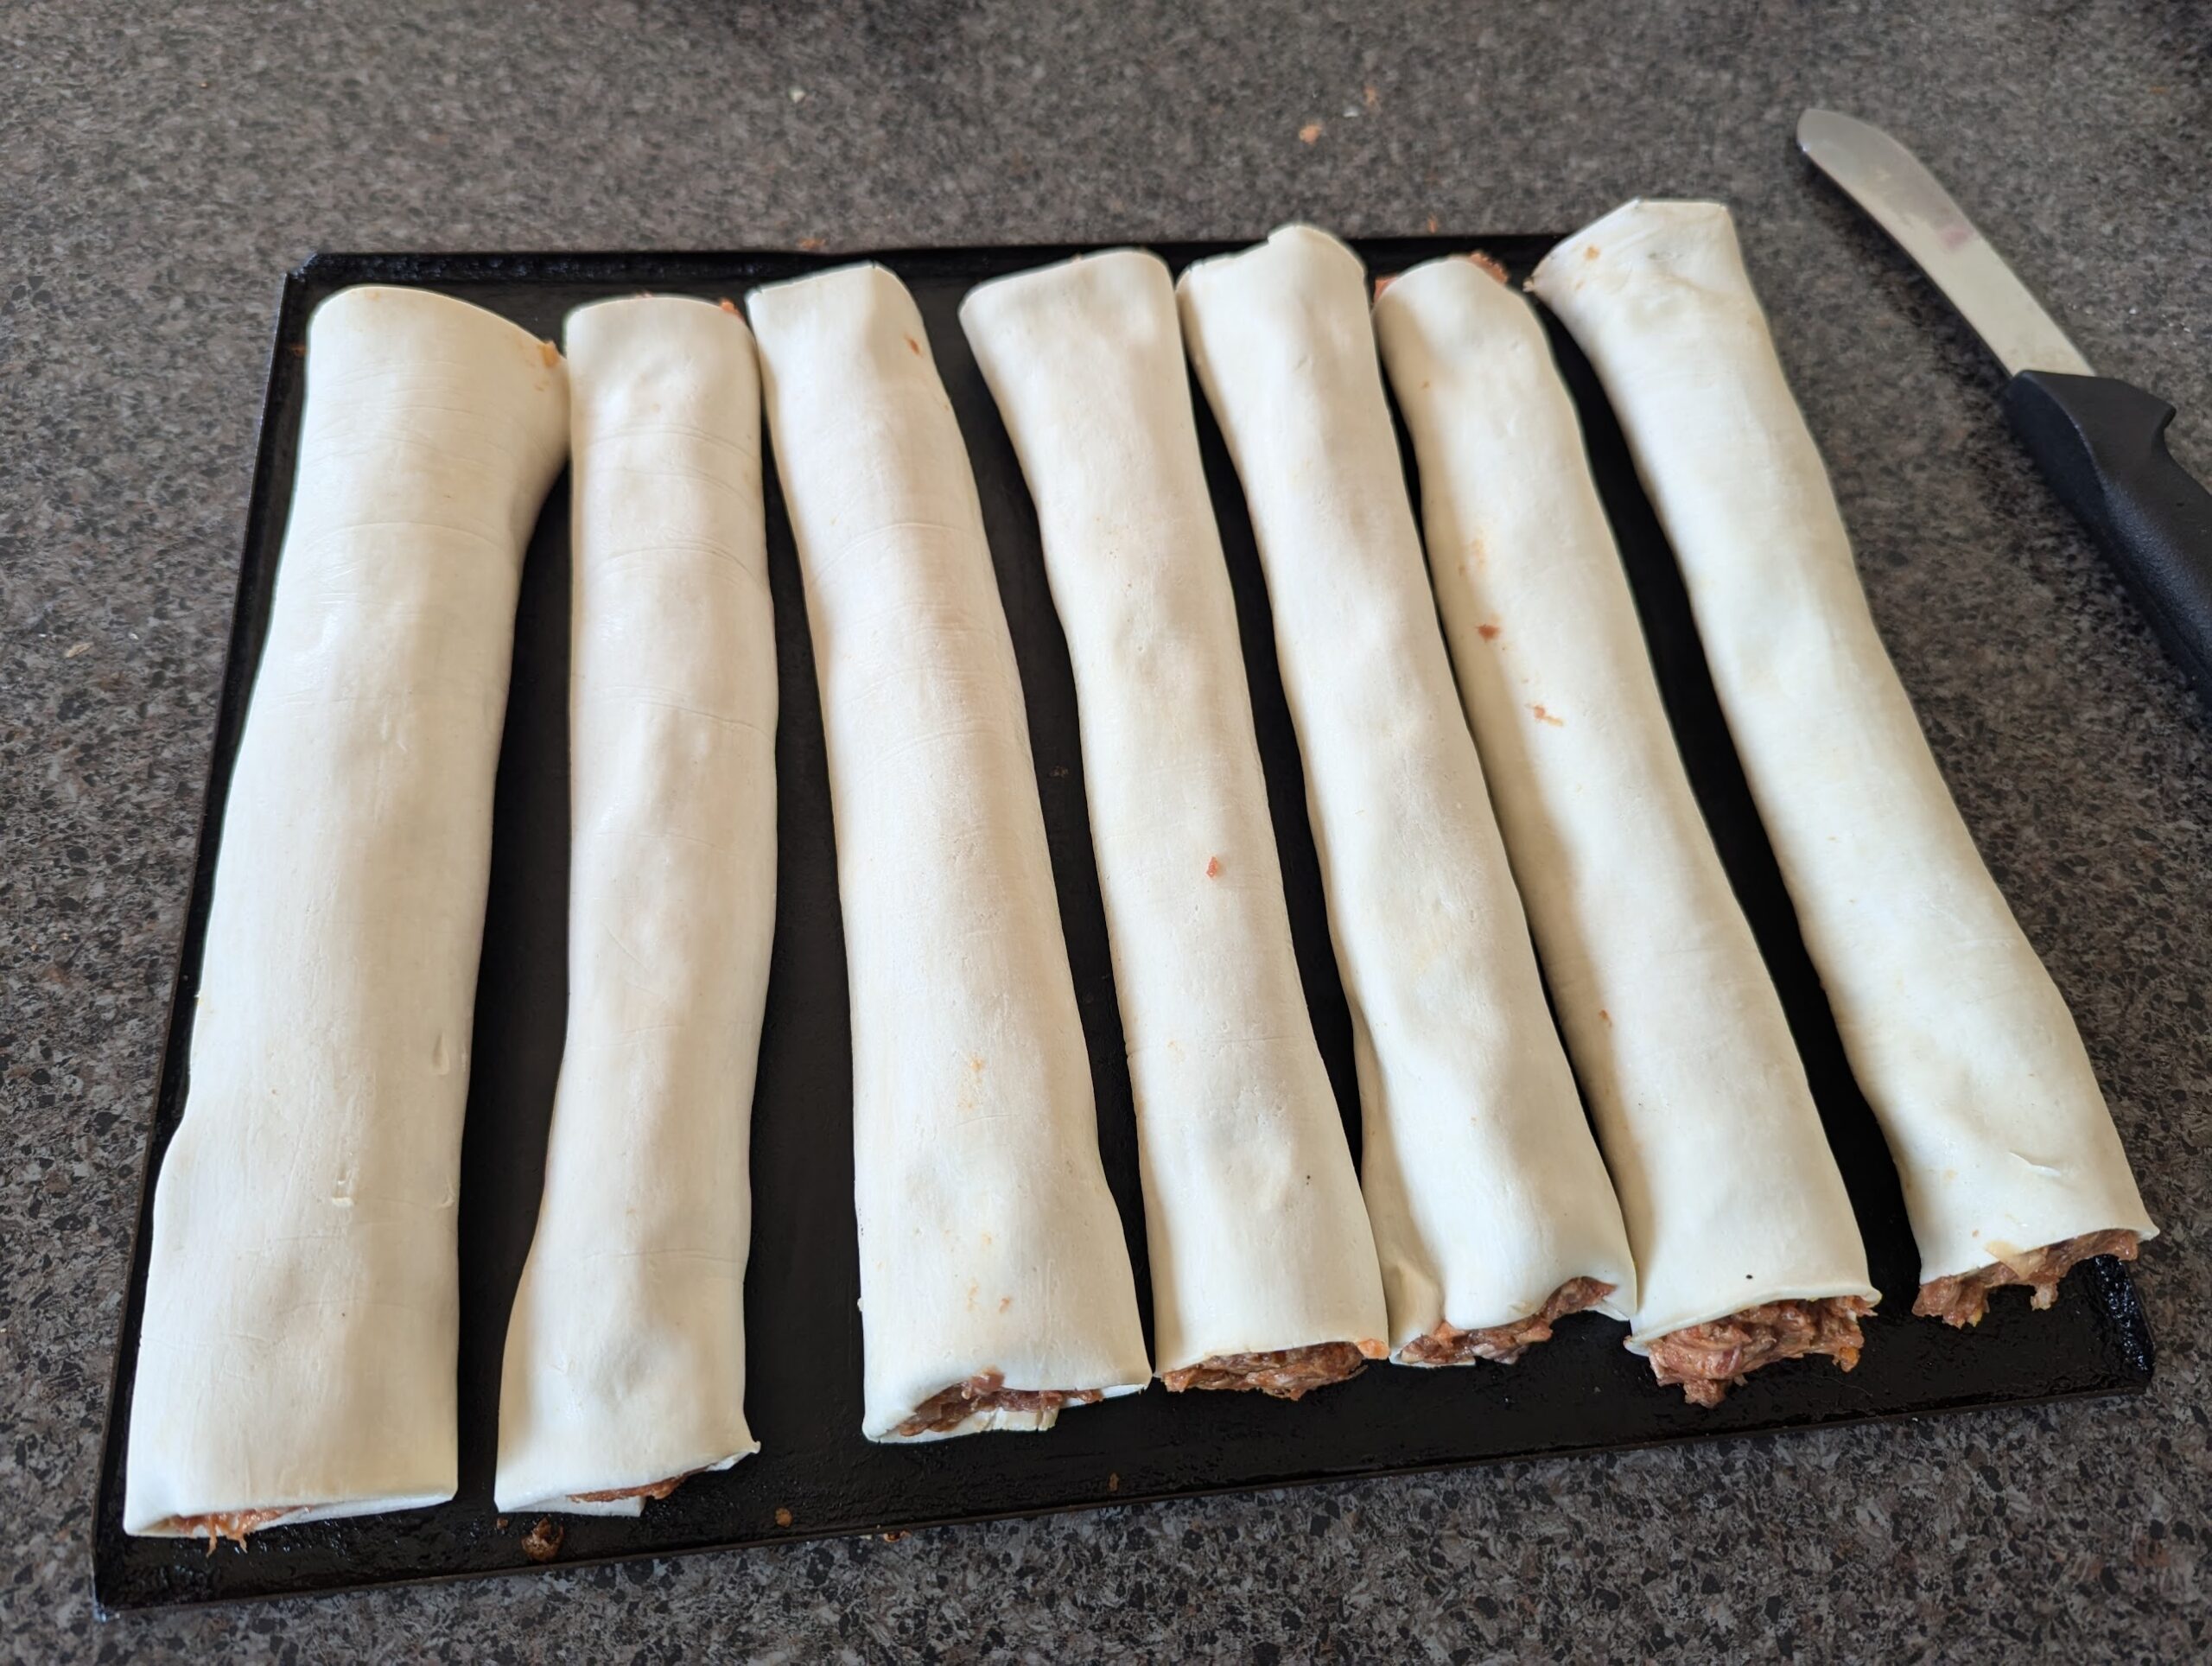
Lay a line of mince along the long edge of the pastry. Roll the pastry over to form the sausage roll and place the finished sausage rolls on a greased (or baking paper lined) tray
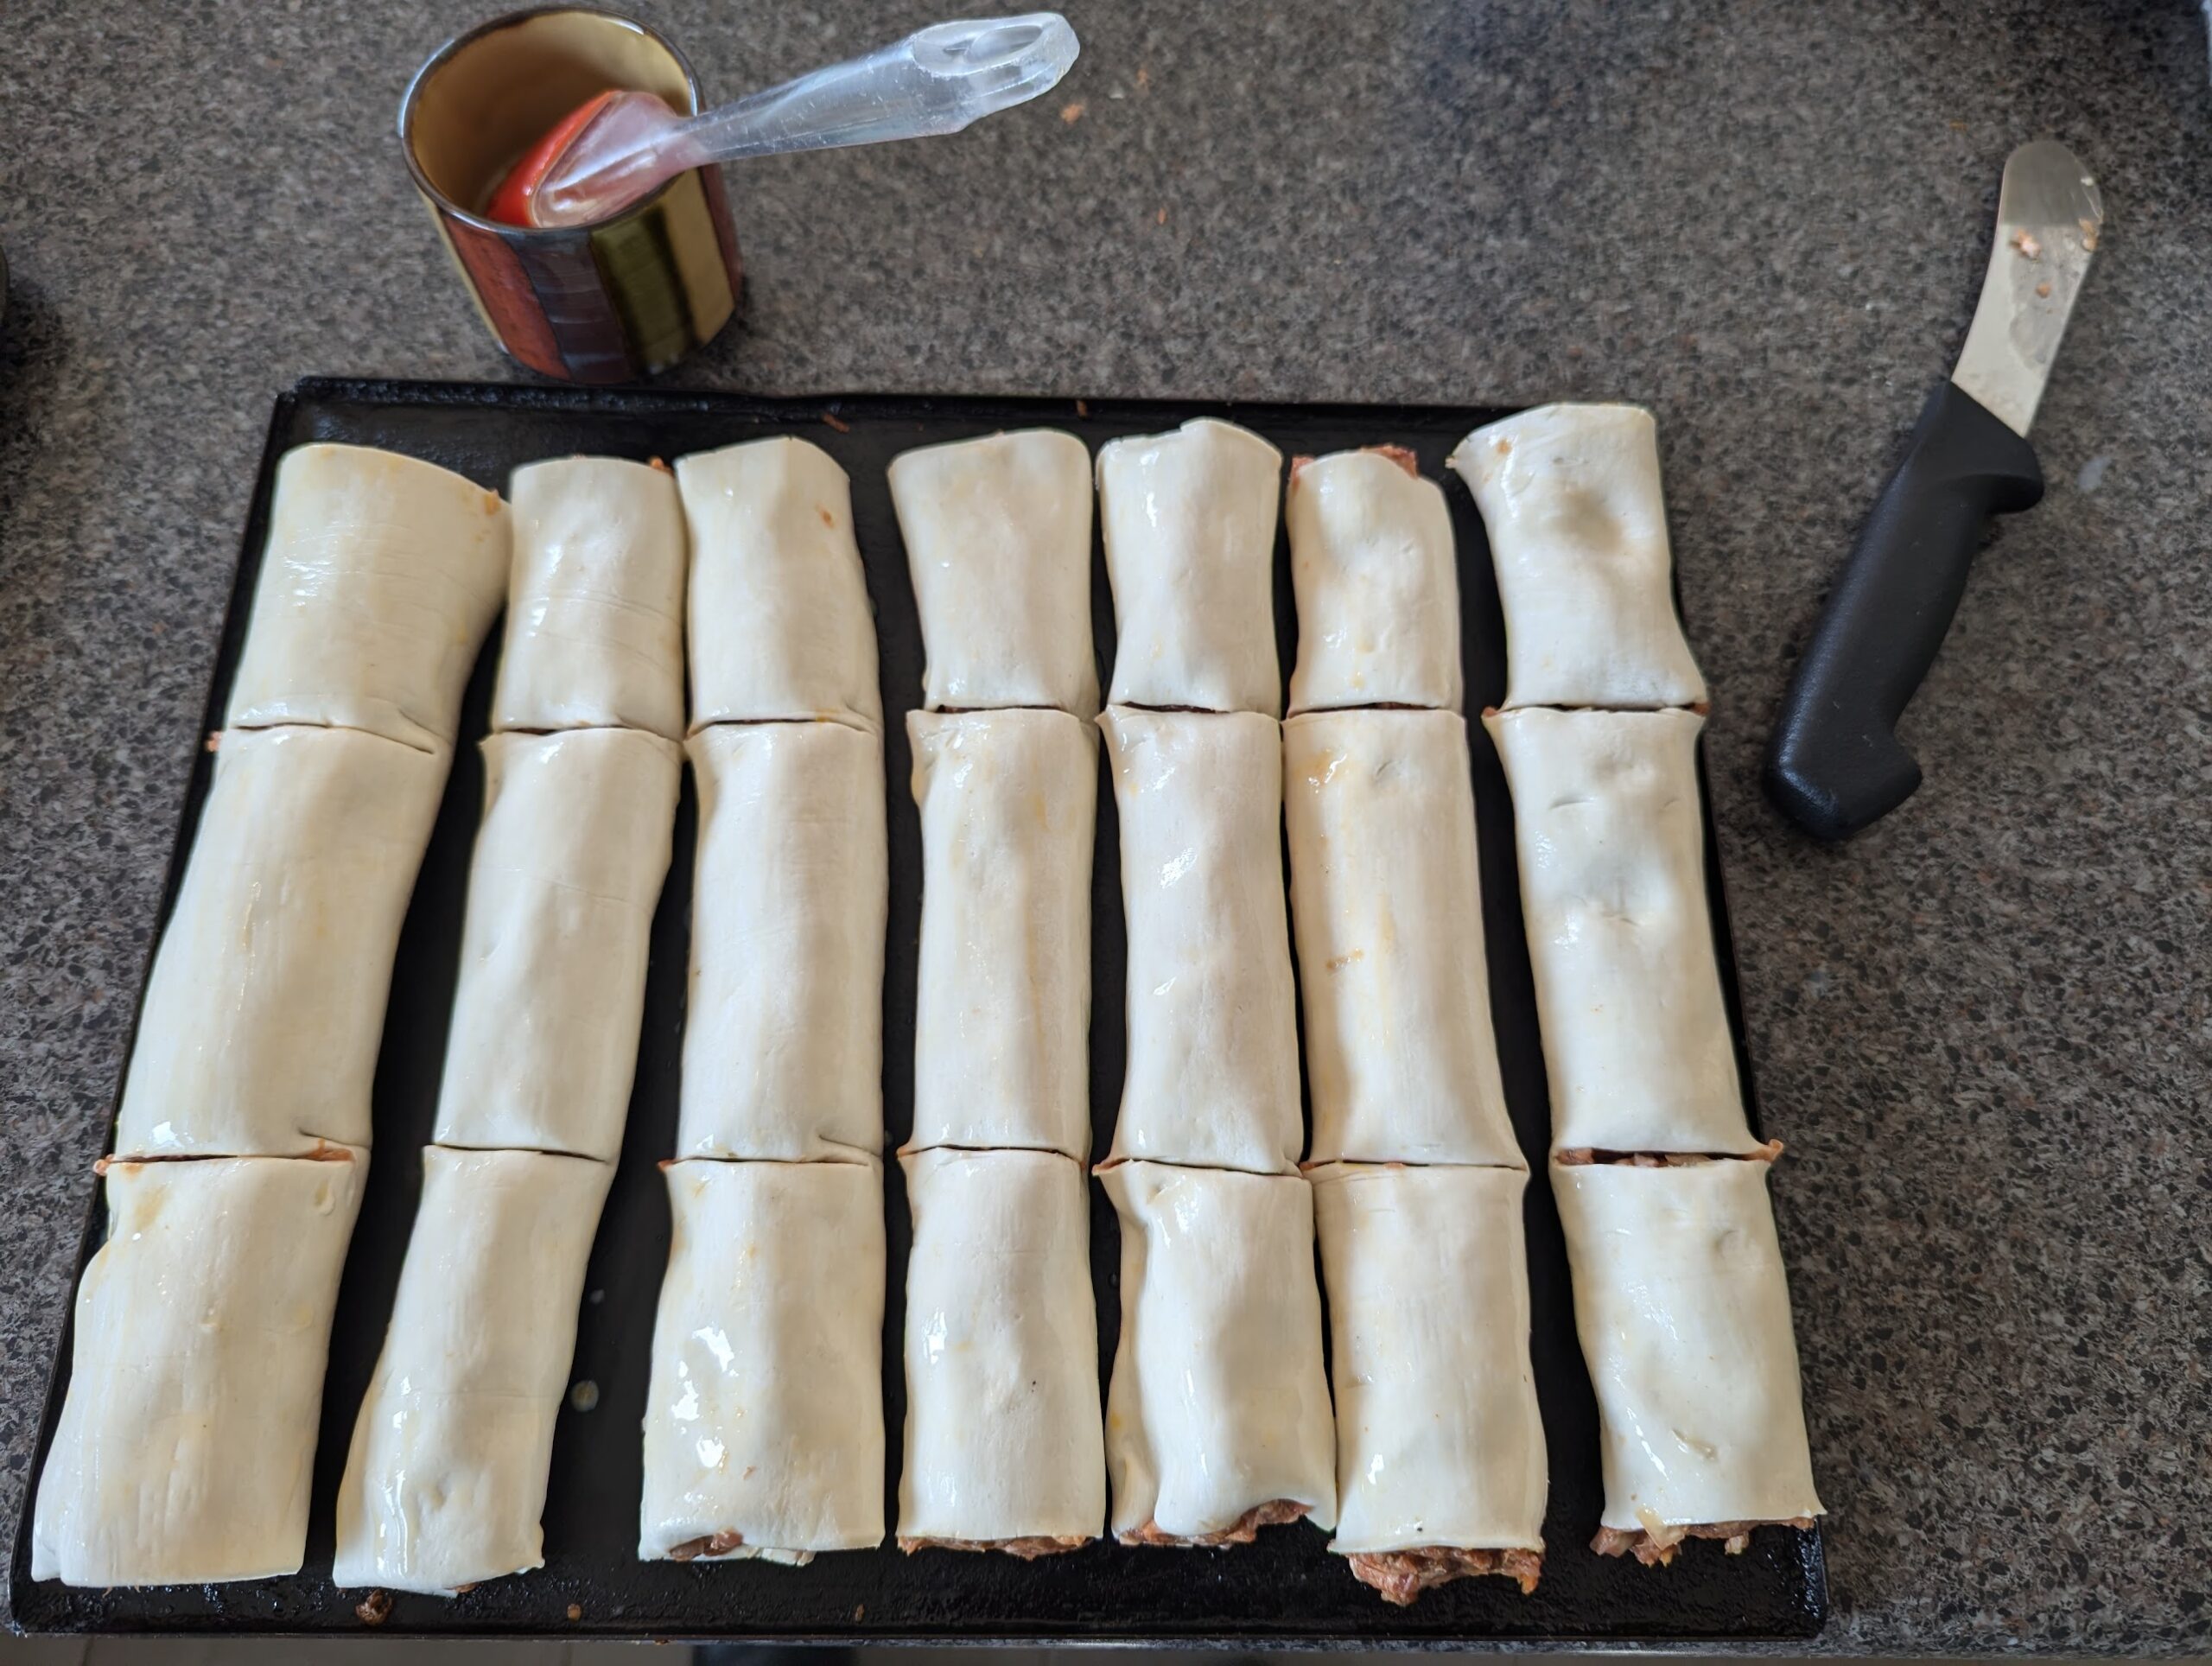
Score the sausage rolls in the size you like and glaze with a beaten egg and milk
Cook for 20 min and until the Sausage rolls are golden brown to your liking.
Notes
There is no salt added to this recipe. I think there is enough salt with the sauces and the pastry.
Throughout my childhood; Mum made her own bread rolls.
To us; they were just everyday, even mundane bread rolls. They fed the family of five when money was tight.
To us they were nothing special; but to my surprise everyone outside of our family absolutely loved them. My cousins could destroy a batch of bread rolls while they were still cooling on the rack before anyone else had a chance. Still to this day it is a core memory for my cousin – Aunty Kerrie’s bread rolls.
I didn’t appreciate them until I was older and started cooking them myself. Bread rolls are my party trick when having guests around for dinner and the guests are more than happy taking the remaining rolls home; if there are any.
But I am here to dismiss the mysticism of “Mum’s bread rolls”. They are great; but there is no unobtainable magic in them, no exotic ingredients that need to be sourced from far away lands and no secret recipe that is passed down only to the oldest of the family.
The recipe actually came that came from the instruction manual of the first bread machine that we purchased all those years ago.
But with a few simple technique improvements; these bread rolls can be taken up a notch from the default bread machine recipe.
So finally for all those people wondering “How”; this is how you make “Mum’s bread rolls.” Try giving them a go yourself.
Mechanical Assistance
For this recipe I use a bread machine. It is a device that my family has used for many years. I think Mum has burnt out three bread machines in her life; running them almost every day when we all lived at home.
I have used a bench mixer with a dough hook when making a double batch of bread rolls with success. The bench mixer can be noisy compared to the bread machine; especially if you have to kneed the dough for 30min. I also hand kneeded the dough while we were away on holidays. It is harder to develop the gluten than the bread machine or a bench mixer; but can be done.
The Recipe
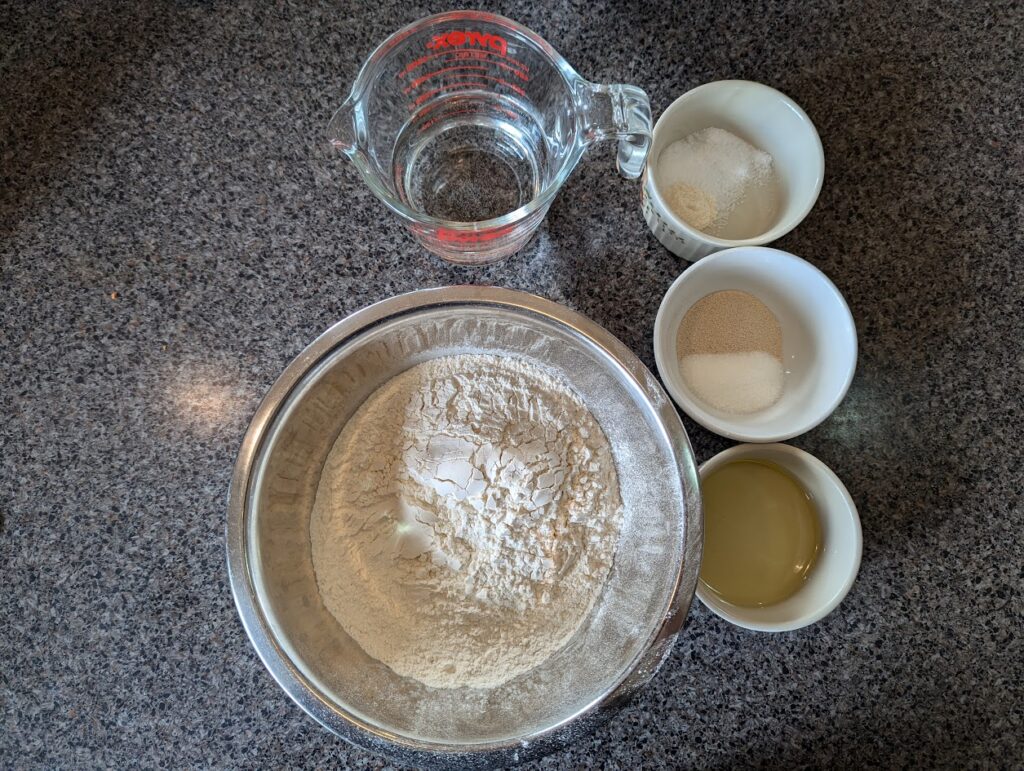
Ingredients
330ml of warm water
2tsp of dried yeast
1tbs of white sugar
1cp wholemeal flour
2 1/2 cp strong baker’s flour
1tsp of Bread improver or 1/4 tsp of ascorbic acid
1tbs of olive oil (or a neutral cooking oil)
1tsp salt
Method
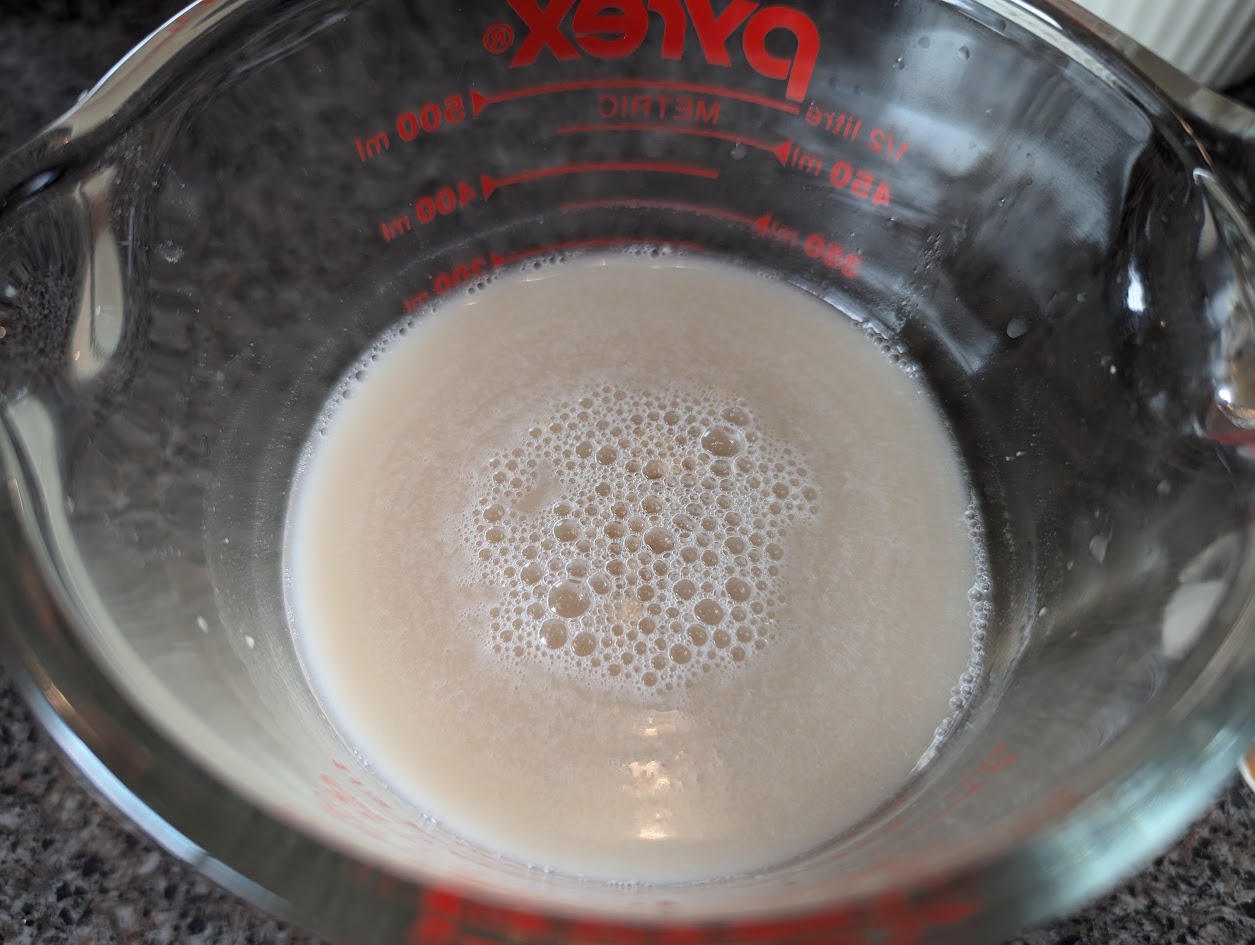
Dissolve the sugar in warm water. Mix in the yeast. Leave for 10min in a warm spot to allow the yeast to activate
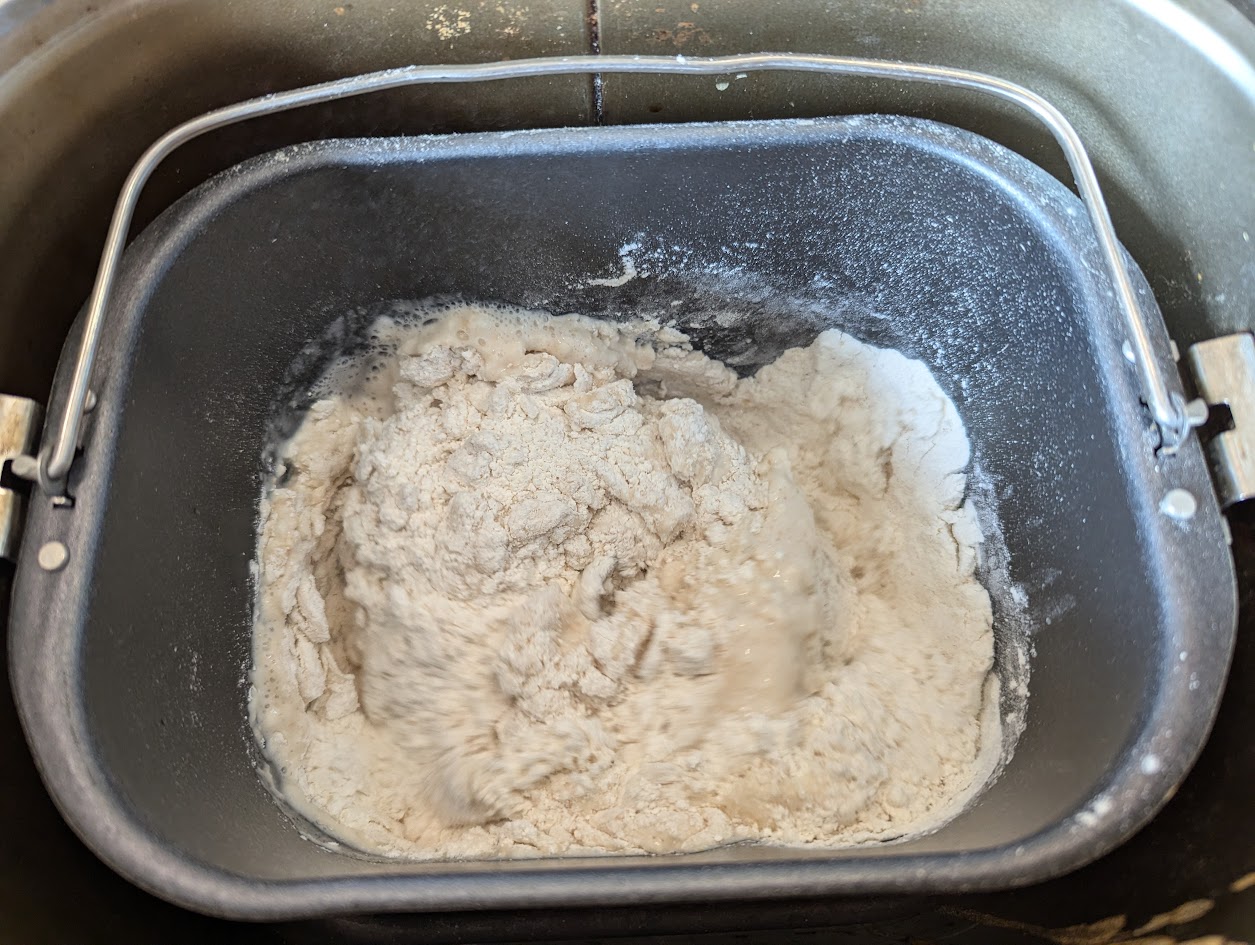
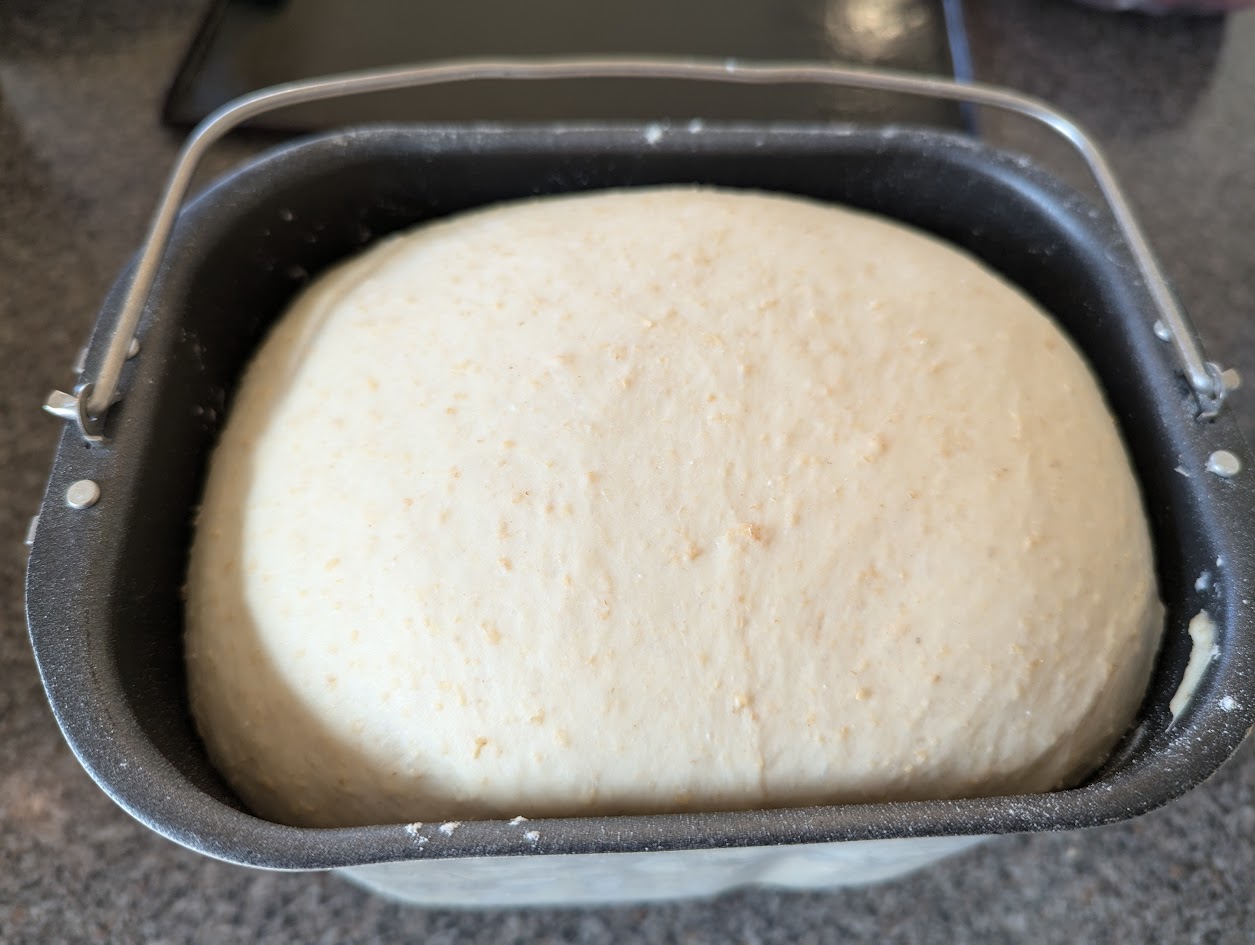
Add all the ingredients in the bread machine and start it on the “dough” setting. Watch for the first 10 minutes to ensure the ingredients combine correctly. You are looking for a smooth dough that only just slightly catches to the side of the bread machine. If it is too sticky; add extra baker’s flour teaspoon by teaspoon. If the dough is too dry and not forming together; add water teaspoon by teaspoon. Allow time for the water to get mixed in because it is very easy to overdo it.
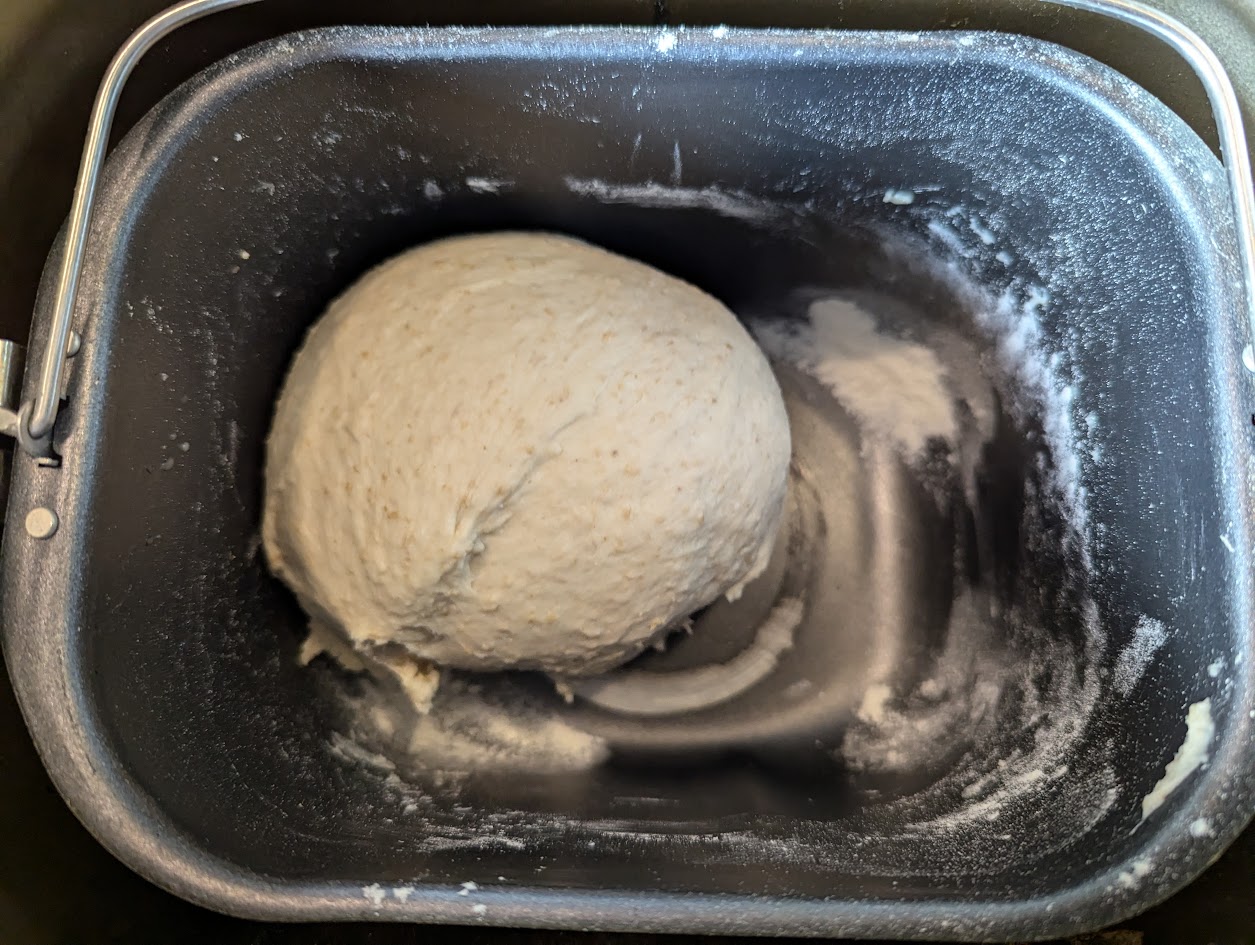
Allow the dough to kneed for 30minutes.
After kneeding; allow the dough to rise for an hour in a warm spot.
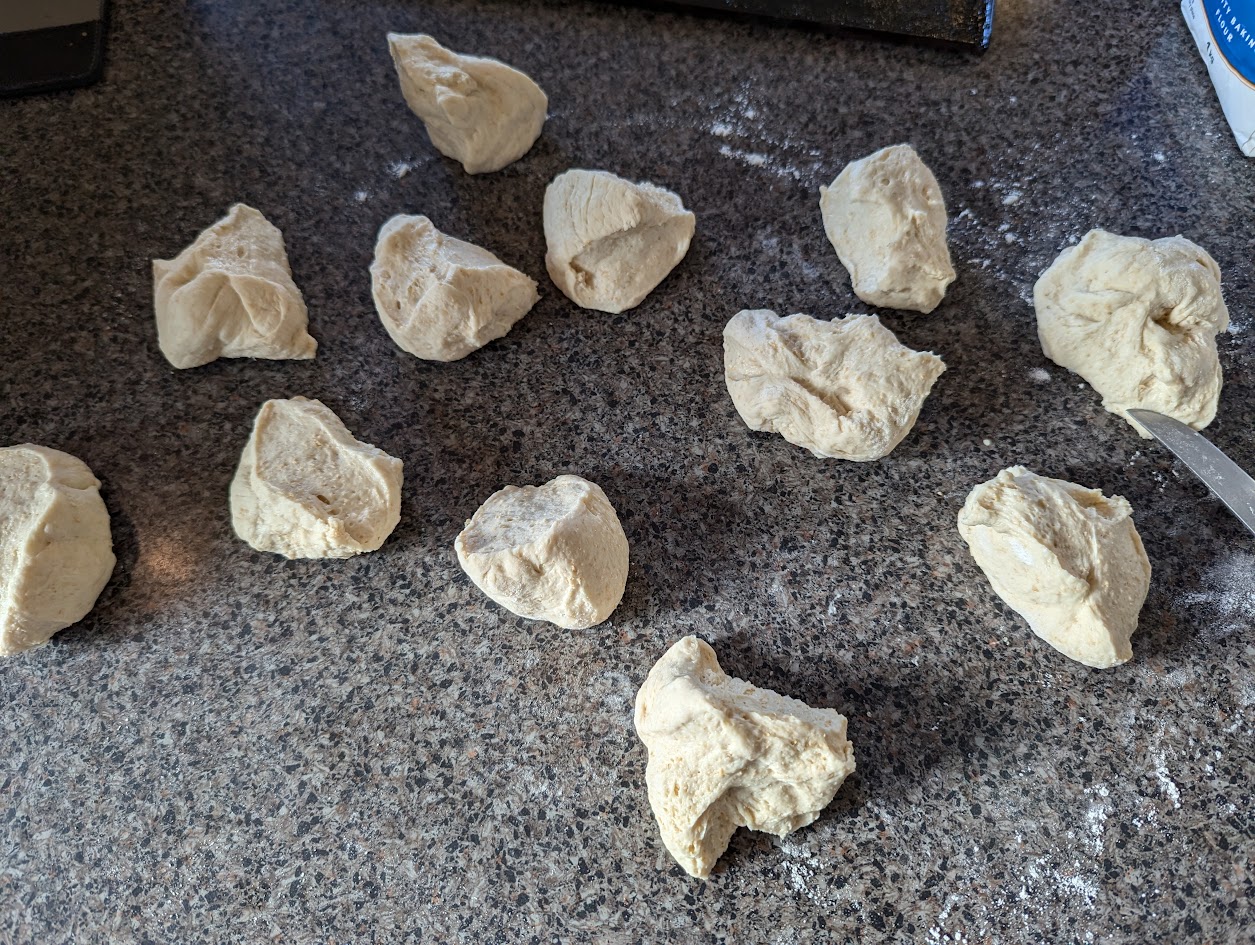
Punch the dough down and turn the dough out on a floured surface. Kneed for a few minutes to release any large air pockets and shape the dough in a rough log shape
Divide the dough up into individual rolls. Typically I divide the dough up into 12 bread rolls. 16 is good if you are feeding kids and 8 is good if you are making rolls as the feature part of a meal (e.g. a schnitzel sandwich)
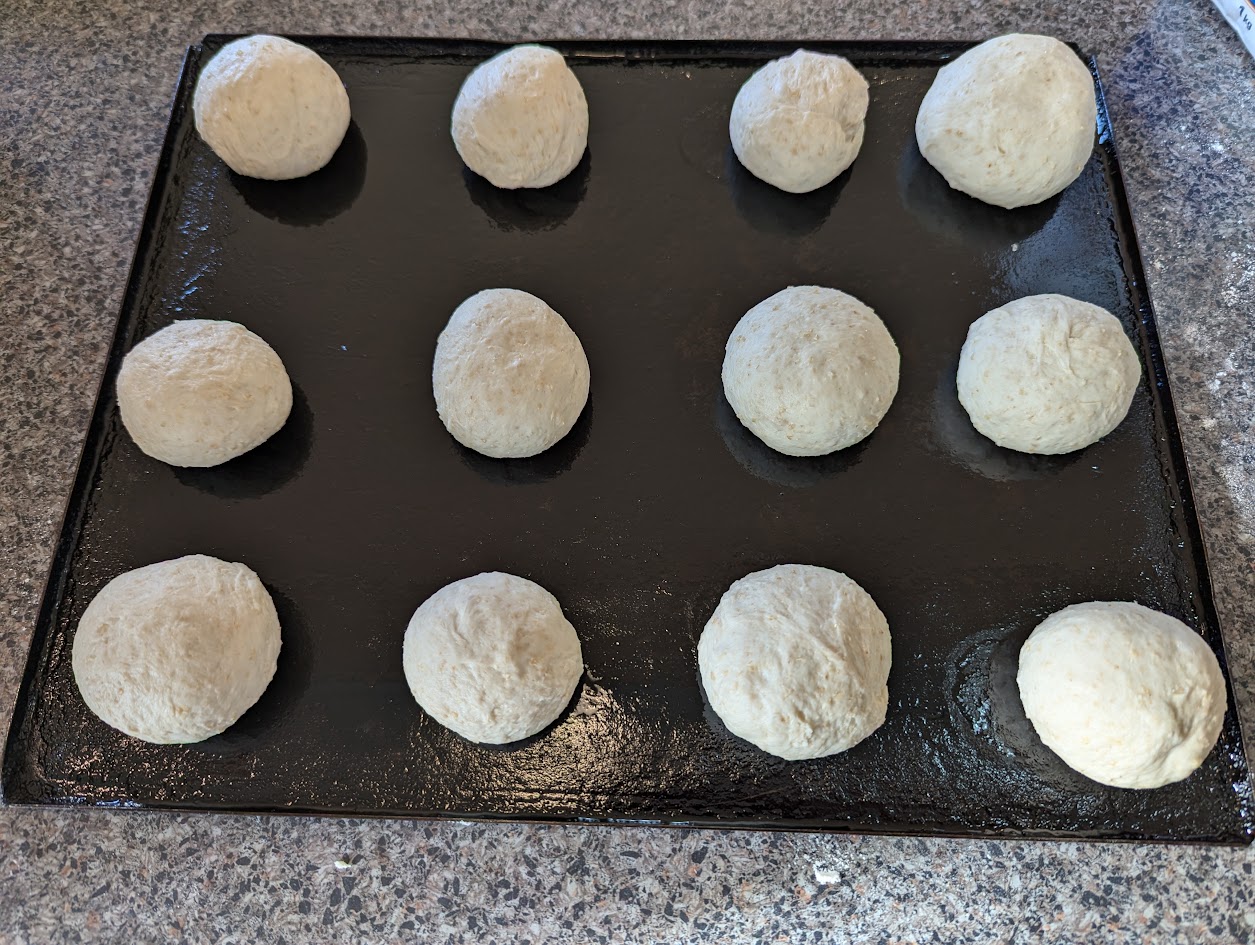
To shape the rolls (I’ll do my best to describe the method). Find a un-floured spot on the bench. You need the dough to ever so slightly stick to the bench top. Ppress down on the clump of dough with the palm of your hand. Make circular motions with your hand to move the dough around and slowly raise it while bringing in your fingers. This will shape the dough into a bread roll.
Add the bread rolls to a lightly oiled heavy baking tray.
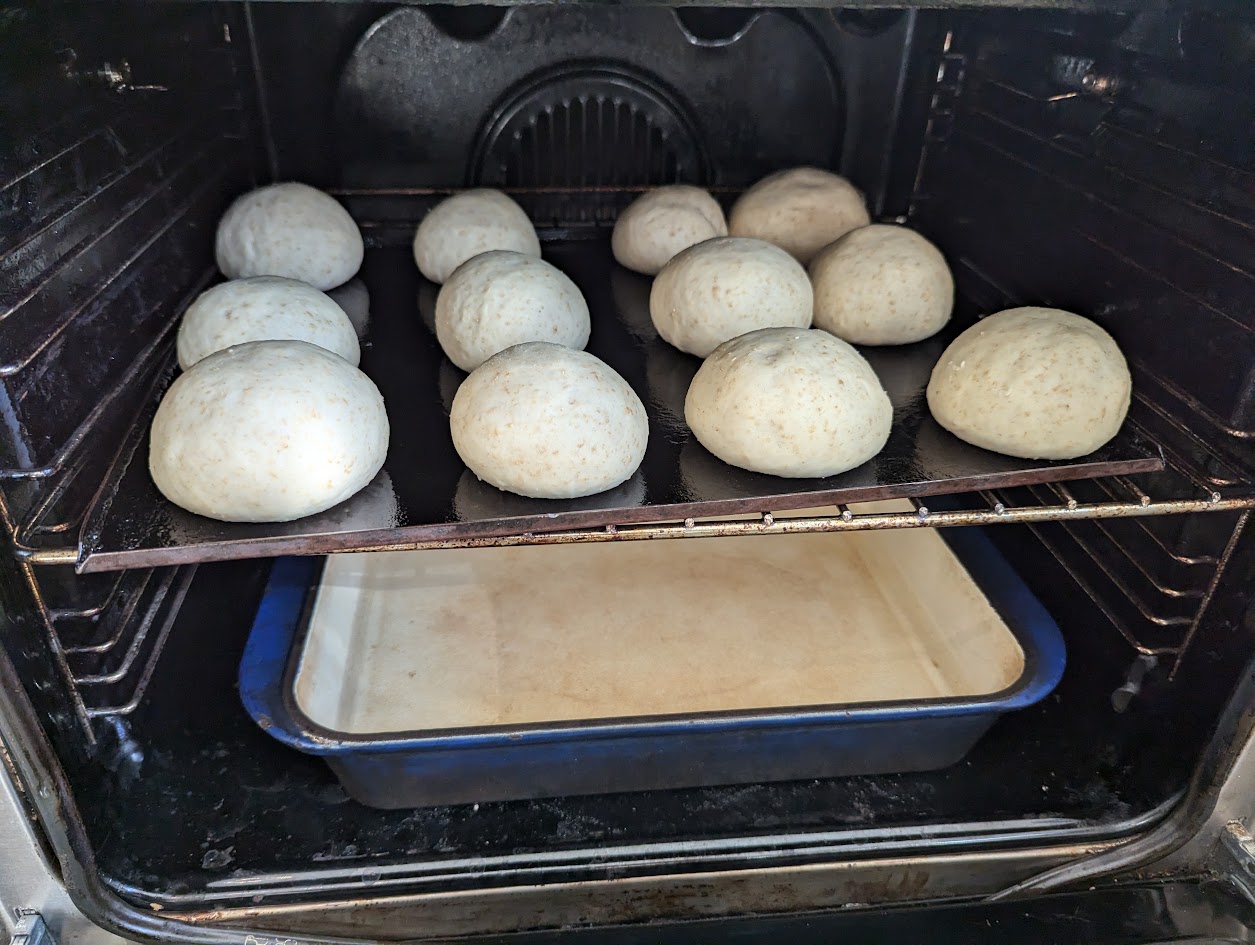
Place the bread rolls in a warm spot and allow them to rise for about 40 minutes; or double in size. Rising time will depend on your ambient temperature; in the colder months I have to position a tray over a heater vent to encourage the bread to rise
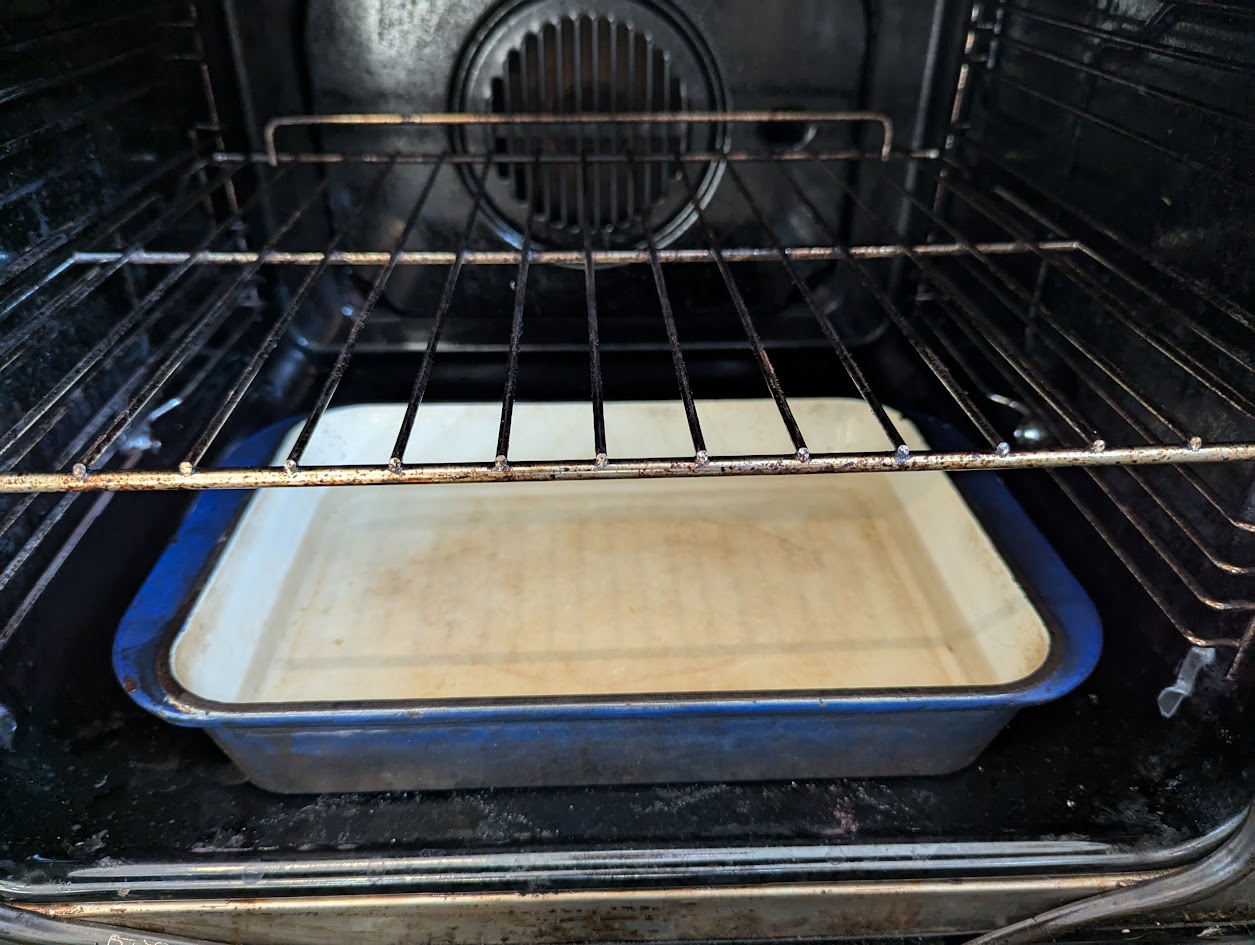
Ten minutes before the bread rolls have completed rising; preheat a oven to 180c. Carefully place a heatproof pan at the bottom of the oven half filled with boiling. This will create steam for the bread rolls to improve the crust on them.
Position the bread rolls in the middle of the oven and bake for 10 minutes. Rotate the tray and cook for another 3 minutes; or until the bread rolls achieve the crust that you want.
Turn onto a wire rack and cool.
Try and keep cousins, children, wife, friends etc from sneaking bread rolls until they are cool enough to eat.
Just a short post on a trick I learnt when upgrading a whole lot of QR boxes on Windows.
As part of the upgrade process; you need to back up the data directory encase you need to back out the upgrade.
The Data directory by default is located in:
C:\Program Files\Attunity\Replicate\data\
Using the inbuilt Windows compression tool (to me) seems slow and sometime unreliable; especially if there is a large amount of data staged when QR was turned off to do the upgrade.
Then I remember that 7zip can be used from the command line. Also an added feature is that 7zip can exclude certain directories so the often large “log” directory can be excluded.
7z a -r -t7z "C:\Program Files\Attunity\Replicate\data.7z" "C:\Program Files\Attunity\Replicate\data\*.*" -xr!logs
This command can also be used in automating the QR upgrade.
Update – Excluding the minidumps directory
Underneath the data directory is a folder called minidumps. It contains dumps when a QR task crashes and used for diagnostics. Some of these files can be quite large.
For a backup – the folder can be ignored; making the archive process run quicker.
7z a -r -t7z "C:\Program Files\Attunity\Replicate\data.7z" "C:\Program Files\Attunity\Replicate\data\*.*" -xr!logs -xr!minidumps
In the organisation that I work in; I have a good old Windows 10 ThinkPad that has been my work horse for many years.
It does the job and works happily with our on Prem apps and I can do most of my role’s development on it.
There are areas where the work horse cannot help me out. For instance, I needed to develop a JavaScript function on a Postgres database to split a field into different elements. I do not have access to be able to develop on the target database; so, I turned to Docker to run a containerised version of Postgres and pgadmin to have a safe area to play in.
The dreaded Linux VM
The “cool” developers have access to Macs to run their DevOps tools on.
I have a Linux VM, running Ubuntu 20.04 on.
It loads slow, it runs slow and the support VM application hogs a significant amount of the memory available, leaving little left for me.
But does allow me to run Docker containers.
The first container I created; broke the VM. The VM support team speculated that a port for Postgres or pgadmin broke the organisation’s VM ports. They rebuilt my VM and I tried again.
docker-compose.yml
This is my docker-compose.yml file for Postgres and pgadmin
There a couple of changes from the boiler plate docker-compose.yml files on the internet:
The ports are mapped to non-standard ports. This is to avoid any potential problems with ports conflicting with the VM software
I had to change the volumes to my home drive due to security settings on my VM
Errors, Problems and Issues (Oh my)
When initially running the docker-compose; I got the following error and pgadmin wouldn’t start.
pgadmin4_container | ERROR  : Failed to create the directory /var/lib/pgadmin/sessions:
pgadmin4_container |            [Errno 13] Permission denied: '/var/lib/pgadmin/sessions'
pgadmin4_container | HINT   : Create the directory /var/lib/pgadmin/sessions, ensure it is writeable by
pgadmin4_container |          'pgadmin', and try again, or, create a config_local.py file
pgadmin4_container |          and override the SESSION_DB_PATH setting per
pgadmin4_container |          https://www.pgadmin.org/docs/pgadmin4/8.9/config_py.html
This issue was resolved from an article from a Stack Overflow thread by changing the ownership of the pg_admin trigger to 5050
sudo chown -R 5050:5050 ~/apps/pg_admin
The next error I had was a “Can’t connect to (‘::’, 80)” error in pgadmin
Again Google and Stack Overflow came to the rescue. The issue was potentially caused if IPv6 is disabled on the VM. I added in the the following line to the yml file:
PGADMIN_LISTEN_ADDRESS: 0.0.0.0
This resolved the issue and now pgadmin could start up.
Inside pgadmin
When I got inside pgadmin; for the life of me I couldn’t connect to the Postgres database.
I could see that the Postres container was running with no errors. I could see the remapped ports. I could connect to Postgres with psql. Why couldn’t I connect to the Postgres in pgadmin?
I was frustrated and tired after a long day of work and had walked away from the computer.
When I got back after a walk around the block and a cup of tea – I could now see the problem and the solution:
Initially I was using “Hostname” as 127.0.0.1 and port as 9432. Because that’s where my mind went to how to connect to the Postgres database running locally.
But because pgadmin is trying to access Postgres from within the docker network; it will be looking for port 5432 instead of 9432 and the container name local_pgdb instead of 127.0.0.1
If I am running from outside the docker; I would use localhost and port 9432. For instance I imported some data to develop off:
The business is doing their best to keep me on my toes with Qlik Replicate; finding new was to bend and stretch the system and consequently my sanity.
The initial request was, “Can we overwrite this field in a Qlik Replicate task with a SOURCE_LOOKUP?”
OK – we can do this. I abhor putting ETL logic in Qlik Replicate tasks and wanting to keep them as simple as possible and allow the power and the flexibility of the downstream systems to manipulate data.
But project timelines were pressing, and I complied with their request.
Later, they came back to me and requested a to add a filter to the derived field in question.
And that led to me and our Tech Business analyst scratching our heads.
If we apply a filter to our focus field; will it use the raw field that is in the table? Or will is use the new lookup field with the same name to base the filter on?
Testing the filters – setting up
To start with; some simple tables in MS-SQL:
CREATE TABLE dbo.TEST_LOOKUP
(
	ACCOUNT_ID INT PRIMARY KEY,
	FRUIT_ID INT,
	FRUIT_NAME VARCHAR(100),
	SOURCE_NAME VARCHAR(100)
);

GO

CREATE TABLE dbo.FRUITS
(
	FRUIT_ID INT PRIMARY KEY,
	NEW_FRUIT_NAME VARCHAR(100)
)

GO

INSERT INTO dbo.FRUITS VALUES(1, 'NEW APPLES');
INSERT INTO dbo.FRUITS VALUES(2, 'NEW ORANGES');
A simple Qlik Replicate task was created to replicate from the table dbo.TEST_LOOKUP.
All columns were brought across instead of FRUIT_NAME. FRUIT_NAME will be overwritten with the source lookup:
Qlik will use the derived source lookup field over the original field in the table.
Conclusion
Once again this highlights the danger of putting ETL code into Qlik Replicate tasks. It obscures business rules and can lead to confusion in operations like the scenario above.
It is best to use Qlik Replicate to get the data out of the source database as quickly and as pure as possible and then use the power of the downstream systems to manipulate the data.
Things that were suggested to us that I did not add to this blog series:
Try Async commits on RDS Postgres. Tried it and got negligible increases.
Shifting the QR server to AWS. Bad idea as there will be even more traffic from the busy DB2 database going across for QR to consume.
Use Amazon Aurora instead of RDS. The downstream developers did not have the appetite to try Aurora; especially with the issues leaning towards network speed.
Use GCP version of Postgres instead of AWS. The downstream developers did not want to commit to another cloud provider.
The problem is how the network connectivity behaves with the Postgres ODBC and the round trips it must do between our location and the AWS data centre. We can try – but we are bound by the laws of physics and the speed of light.
Decisions to be made.
All though our benchmarking and investigation; we have been replicating to a Development MS-SQL database in the data centre as the DB2 database in parallel to give us an idea of what speed we could potentially reach. Without triggers on the MS-SQL destination table; we were easily hitting 300tps. Ramping the changes up; we can hold at 1K tps with no creep in latency.
We were happy with these results; especially with the MS-SQL database was just a small underpowered shared Dev machine; not a full-blown dedicated server.
It took a brave solution architect to propose that we shift from AWS RDS Postgres to an on prem MS-SQL server; especially when our senior management strategy is to push everything to the cloud to reduce the number of on prem servers.
In the end with all our evidence on the performance and the project’s willingness to push on with the proposed solution, the solution stakeholders agreed to move the destination to an on prem database.
They initially wanted us to go with a on prem Postgres database; but since all our Database Administrators are either Oracle or MS-SQL experts and we have no Postgres experts – we went to good old MS-SQL.
It worked; but…damn triggers.
I volunteered to convert the Postgres SQL code into T-SQL as I have worked with T-SQL for the past decade. The conversion went smoothly, and I took the opportunity to optimise several sections of the code to make the solution more maintainable and to run faster.
With our new MS-SQL database all coded up and the triggers turned off; the SVT (stress and volume testing) ran at the TPS for which we were aiming.
But when we turned on the triggers; the performance absolutely crashed.
I was mortified – was it my coding shot and the additional changes that I made the performance worse?
I checked the triggers. I checked the primary keys and the joins. I checked the horizontal partitioning. I checked the database server stats for CPU and memory usage.
Nothing – could not locate the performance problem.
I went back to Qlik Replicate and examined the log files.
Ahh – here is something. The log file was full of entries like this:
00012472: 2024-05-27T16:03:54 [TARGET_APPLY ]W: Source changes that would have had no impact were not applied to the target database. Refer to the 'attrep_apply_exceptions' table for details (endpointshell.c:7632)
Looking inside the attrep_apply_exceptions there corresponding entries like:
UPDATE [dbo].[TEST_DESTINATION]
SET	[ACCOUNT_ID] = 2,
	[DATA_1] = 'Updated',
	[DATA_2] = 'Data'
WHERE
	[ACCOUNT_ID] = 2;
	-- 0 rows affected
Which was confusing; I checked the destination table, and the update was applied. Why was this update deemed a failure and logged to the attrep_apply_exceptions table? It must be an error in the trigger.
The cause of the problem
Our code can be paraphrased like:
CREATE TABLE dbo.TEST_DESTINATION
(
	ACCOUNT_ID int NOT NULL,
	DATA_1 varchar(100) NULL,
	DATA_2 varchar(100) NULL,
	PRIMARY KEY CLUSTERED
	(
		ACCOUNT_ID ASC
	)
);

GO

CREATE TABLE dbo.TEST_MERGE_TABLE
(
	ACCOUNT_ID int NOT NULL,
	DATA_1 varchar(100) NULL,
	DATA_2 varchar(100) NULL,
	DATA_3 varchar(100) NULL,
	PRIMARY KEY CLUSTERED
	(
		ACCOUNT_ID ASC
	)
)

GO

CREATE OR ALTER TRIGGER dbo.TR_TEST_DESTINATION__INSERT
ON dbo.TEST_DESTINATION
AFTER INSERT
AS
	INSERT INTO dbo.TEST_MERGE_TABLE
	SELECT
		ACCOUNT_ID,
		DATA_1,
		DATA_2,
		'TRIGGER INSERT' AS DATA_3
	FROM INSERTED;

GO

CREATE OR ALTER TRIGGER [dbo].[TR_TEST_DESTINATION__UPDATE]
ON [dbo].[TEST_DESTINATION]
AFTER UPDATE
AS
	UPDATE dbo.TEST_MERGE_TABLE
	SET ACCOUNT_ID = X.ACCOUNT_ID,
		DATA_1 = X.DATA_1,
		DATA_2 = X.DATA_2,
		DATA_3 = 'TRIGGER DATA'
	FROM dbo.TEST_MERGE_TABLE T
	JOIN INSERTED X
	ON X.ACCOUNT_ID = T.ACCOUNT_ID
	WHERE
		1 = 0;  -- This predicate can be either true or false.  For example we set it false

GO
The problem is in how the trigger TR_TEST_DESTINATION__UPDATE behaves if it returns 0 rows. This can be a legitimate occurrence depending on a join in the trigger.
If I run a simple update like:
UPDATE dbo.TEST_DESTINATION
SET DATA_1 = 'Trigger Upate'
WHERE
	ACCOUNT_ID = 1;
The SQL engine returns:
(0 row(s) affected)    -- Returned from the trigger

(1 row(s) affected)    -- Returned from updating dbo.TEST_DESTINATION
My theory is that Qlik Replicate when reading the rows returned from executing the SQL statement on the destination server; only considers the first row to determine if the change was a success or not. Since the first row is an output from the trigger with 0 rows affected; Qlik considers that the update was a failure and therefore logs it into the attrep_apply_exceptions table.
Apart from this been incorrect as the trigger code is logically working correctly; Qlik Replicate must make another trip to write to the exception table. This resulted in drastically increased latency.
Fixing the issue
The fix (once the problem is known) is relatively straight forward. Any rows returned needs to be supressed from the trigger. For example:
CREATE OR ALTER TRIGGER [dbo].[TR_TEST_DESTINATION__UPDATE]
ON [dbo].[TEST_DESTINATION]
AFTER UPDATE
AS
BEGIN
	SET NOCOUNT ON;  -- Supress returning the row count

	UPDATE dbo.TEST_MERGE_TABLE
	SET ACCOUNT_ID = X.ACCOUNT_ID,
		DATA_1 = X.DATA_1,
		DATA_2 = X.DATA_2,
		DATA_3 = 'TRIGGER DATA'
	FROM dbo.TEST_MERGE_TABLE T
	JOIN INSERTED X
	ON X.ACCOUNT_ID = T.ACCOUNT_ID
	WHERE
		1 = 0;  -- This predicate can be either true or false
END
When the update statement is run again; the following is returned:
(1 row(s) affected)
Qlik Replicate will now consider the update as a success and not log it as an exception.
Continuing our ongoing Qlik Replicating story of trying to replicate a DB2/zOS database to AWS RDS Postgres.
We made small improvements; but nothing substantial to reach the TPS for which we were aiming. I was at my experience end of what I knew and decided to reach for professional help.
We have a support relationship with IBT; who helped us out with the initial set up QR in our organisation. But recently we have been self-resolving our own problems and have not been using their help. Now this was suitable time to ask for their help.
IBT has always been helpful when we have asked for assistance. Another handy aspect with the relationship is that IBT has a quick support relationship with Qlik. If they don’t know the answer; they can get the answer easily from Qlik.
IBT asked us to collect the usual data; diagnostic logs, source and target DB metrics and QR server core metrics. Nothing looked under duress, so IBT dived into the nitty and gritty details of the diagnostic packs.
Their techs noticed that our outgoing stream buffers were full. This means that the changes were coming in faster than were getting sent out to the destination. IBT suggested to try increasing the size of the outgoing stream.
It was a marginal improvement. Measured in a thimble full of performance improvement. Still nowhere near the TPS we needed.
IBT asked us to increase the two variables in small increments of “stream_buffers_number” + 5 and “stream_buffer_size” + 10. With each increase there was a minuscule improvement.
But more worrying with each increase; the QR task was using more memory to the point that increasing the buffer size was unsustainable with the resources on the server. Even if increasing the buffer variables and the gained TPS was linear relationship; we would need a very beefy server to reach 300 TPS.
So again, it was a little gain; and with all the added “Little gains” over the past few fix iterations we were still no closer to our needed 300 TPS.
Increasing the buffer variables might be helpful if you are close to your TPS and trying to get over the last hurdle. But since we’re so far behind; we had to look for another solution.
Websites store cookies to enhance functionality and personalise your experience. You can manage your preferences, but blocking some cookies may impact site performance and services.
Essential cookies enable basic functions and are necessary for the proper function of the website.
Name
Description
Duration
Cookie Preferences
This cookie is used to store the user's cookie consent preferences.
30 days
These cookies are needed for adding comments on this website.
Name
Description
Duration
comment_author
Used to track the user across multiple sessions.
Session
comment_author_email
Used to track the user across multiple sessions.
Session
comment_author_url
Used to track the user across multiple sessions.
Session
Statistics cookies collect information anonymously. This information helps us understand how visitors use our website.
Google Analytics is a powerful tool that tracks and analyzes website traffic for informed marketing decisions.
Contains information related to marketing campaigns of the user. These are shared with Google AdWords / Google Ads when the Google Ads and Google Analytics accounts are linked together.
90 days
__utma
ID used to identify users and sessions
2 years after last activity
__utmt
Used to monitor number of Google Analytics server requests
10 minutes
__utmb
Used to distinguish new sessions and visits. This cookie is set when the GA.js javascript library is loaded and there is no existing __utmb cookie. The cookie is updated every time data is sent to the Google Analytics server.
30 minutes after last activity
__utmc
Used only with old Urchin versions of Google Analytics and not with GA.js. Was used to distinguish between new sessions and visits at the end of a session.
End of session (browser)
__utmz
Contains information about the traffic source or campaign that directed user to the website. The cookie is set when the GA.js javascript is loaded and updated when data is sent to the Google Anaytics server
6 months after last activity
__utmv
Contains custom information set by the web developer via the _setCustomVar method in Google Analytics. This cookie is updated every time new data is sent to the Google Analytics server.
2 years after last activity
__utmx
Used to determine whether a user is included in an A / B or Multivariate test.
18 months
_ga
ID used to identify users
2 years
_gali
Used by Google Analytics to determine which links on a page are being clicked
30 seconds
_ga_
ID used to identify users
2 years
_gid
ID used to identify users for 24 hours after last activity
24 hours
_gat
Used to monitor number of Google Analytics server requests when using Google Tag Manager