We have been doing a bit of “Stress and Volume” testing in Qlik Replicate over the past few days; investigating how my latency is introduced to a MS SQL server task if we run it through a log stream.
If you’re not aware – you can get minute latecy from Qlik Replicate by turning the “Performance” logs up to “Trace” or higher:
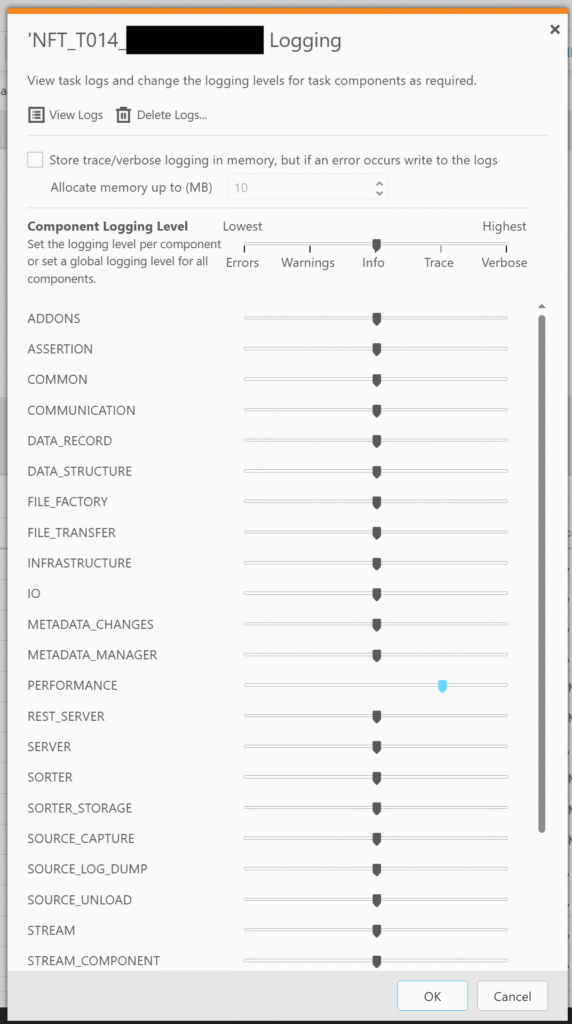
This will result in messages getting produced in the task’s log file like:
00011044: 2025-08-04T14:57:56 [PERFORMANCE     ]T:  Source latency 1.23 seconds, Target latency 2.42 seconds, Handling latency 1.19 seconds  (replicationtask.c:3879)
00011044: 2025-08-04T14:58:26 [PERFORMANCE     ]T:  Source latency 1.10 seconds, Target latency 2.27 seconds, Handling latency 1.16 seconds  (replicationtask.c:3879)
00009024: 2025-08-04T14:58:30 [SOURCE_CAPTURE  ]I:  Throughput monitor: Last DB time scanned: 2025-08-04T14:58:30.700. Last LSN scanned: 008050a1:00002ce8:0004. #scanned events: 492815.   (sqlserver_log_utils.c:5000)
00011044: 2025-08-04T14:58:57 [PERFORMANCE     ]T:  Source latency 0.61 seconds, Target latency 1.87 seconds, Handling latency 1.25 seconds  (replicationtask.c:3879)
00011044: 2025-08-04T14:59:27 [PERFORMANCE     ]T:  Source latency 1.10 seconds, Target latency 1.55 seconds, Handling latency 0.45 seconds  (replicationtask.c:3879)
I created a simple python script to parse a folder of log files and output it in a excel. Since the data ends up in a panda data frame; it would be easy to manipulate the data and output it in a specific way:
import os
import pandas as pd
from datetime import datetime


def strip_seconds(inString):

    index = inString.find(" ")
    returnString = float(inString[0:index])
    return(returnString)


def format_timestamp(in_timestamp):

    # Capture dates like "2025-08-01T10:42:36" and add a microsecond section
    if len(in_timestamp) == 19:
        in_timestamp = in_timestamp + ":000000"

    date_format = "%Y-%m-%dT%H:%M:%S:%f"

    # Converts date string to a date object
    date_obj = datetime.strptime(in_timestamp, date_format)

    return date_obj


def process_file(in_file_path):

    return_array = []

    with open(in_file_path, "r") as in_file:

        for line in in_file:

            upper_case = line.upper().strip()

            if upper_case.find('[PERFORMANCE     ]') >= 0:
                timestamp_temp = upper_case[10:37]
                timestamp = timestamp_temp.split(" ")[0]

                split_string = upper_case.split("LATENCY ")

                if len(split_string) == 4:

                    source_latency = strip_seconds(split_string[1])
                    target_latency = strip_seconds(split_string[2])
                    handling_latency = strip_seconds(split_string[3])

                    # Makes the date compatible with Excel
                    date_obj = format_timestamp(timestamp)
                    excel_datetime = date_obj.strftime("%Y-%m-%d %H:%M:%S")

                    # If you're outputting to standard out
                    #print(f"{in_file_path}\t{time_stamp}\t{source_latency}\t{target_latency}\t{handling_latency}\n")

                    return_array.append([in_file_path, timestamp, excel_datetime, source_latency, target_latency, handling_latency])

    return return_array


if __name__ == '__main__':

    log_folder = "/path/to/logfile/dir"
    out_excel = "OutLatency.xlsx"

    latency_data = []

    # Loops through files in log_folder
    for file_name in os.listdir(log_folder):

        focus_file = os.path.join(log_folder, file_name )

        if os.path.isfile(focus_file):
            filename, file_extension = os.path.splitext(focus_file)

            if file_extension.upper().endswith("LOG"):
                print(f"Processing file: {focus_file}")
                return_array = process_file(focus_file)

                latency_data += return_array


    df = pd.DataFrame(latency_data, columns=["File Name", "Time Stamp", "Excel Timestamp", "Source Latency", "Target Latency", "Handling Latency"])
    df.info()

    # Dump file to Excel; but you can dump to other formats like text etc
    df.to_excel(out_excel)
And voilà – we have an output to Excel to quickly create statistics on latency for a given task(s).
What statistics to use?
Latency is something you can analyse in different ways, depending on what you’re trying to answer. It is also important to pair latency statistics with the change volume that is coming through.
Has the latency jumped at a specific time because the source database is processing a daily batch? Is there a spike of latency around Christmas time where there are more financial transactions compared to a benign day in February?
Generally, if the testers are processing the latency data they provide back:
- Average target latency
- 90th percentile target latency
- 95th percentile target latency
- Min target latency
- Max target latency
This is what we use to compare two runs to each other when the source load is consistent and we’re changing a Qlik Replicate task